Apple on September 16 released macOS Sequoia, the latest version of the company's Mac operating system. macOS Sequoia introduces interactive iPhone Mirroring, easier window tiling, a new Passwords app, and updated capabilities across the platform.

In this article, we've selected 50 new features and lesser-known changes that are worth checking out if you're upgrading. What do you think of macOS Sequoia so far? Let us know in the comments.
1. Distraction Control

If you are tired of pop-ups and banners interrupting your web browsing experience, it's worth getting to know Distraction Control, a new Safari feature that helps you focus on the content that matters by minimizing intrusive elements on webpages. While it's not designed as an ad blocker, Distraction Control can significantly improve your reading experience by hiding static distractions.

To nix a distracting item on a webpage, click the Page menu icon in the address bar and select Hide Distracting Items. Then simply hover your pointer over the item in question, whereupon it will be auto-selected for removal. With another click, the distraction will disintegrate before your eyes. When you're finished, click Done in the address bar. If you're on a webpage where you've hidden items, a crossed out eye icon will appear in the address bar, indicating that you can make them visible again by revisiting the Page menu and selecting Show Hidden Items.
2. Window Tiling
With macOS Sequoia, Apple has introduced a new window tiling management feature that aims to make it easy to arrange open windows into a layout that works best for you. When you drag a window to the edge of the screen, macOS Sequoia suggests a tiled position by displaying a frame, and you release the window to drop it right into place. This way, you can quickly arrange two app windows side by side, or place four windows in corners to keep several apps in view at once. When a window has been dragged to tile on one side or the other, dragging it back immediately resizes it to its original width and height.
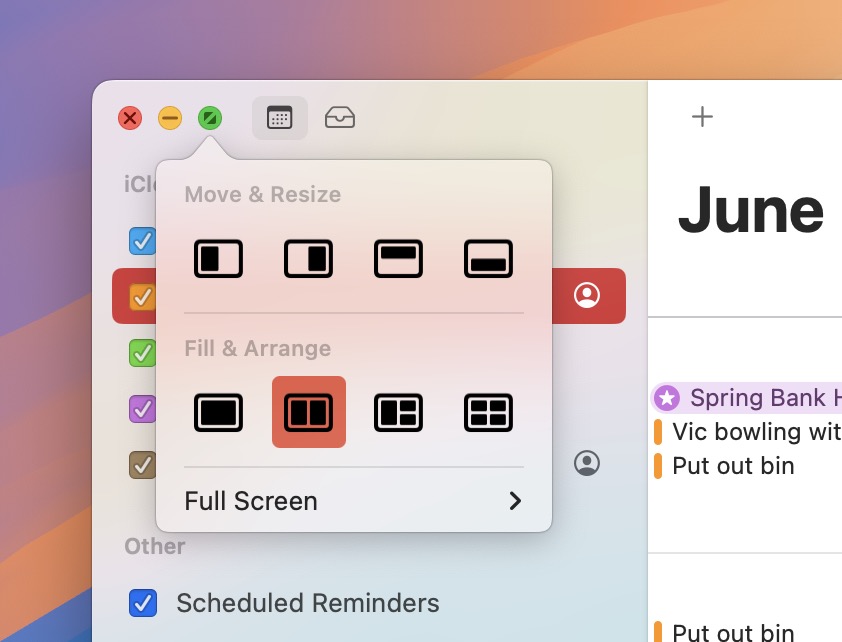
macOS 15 also adds new tiling options to the green traffic light in the top corner of windows. Hover your pointer over the green button, and a menu appears with options to move and resize or fill and arrange all open windows.
3. Adjust AirPods Adaptive Audio
Apple's second-generation AirPods Pro have an Adaptive Audio feature that includes Adaptive Noise Control, Personalized Volume, and Conversation Awareness, which are all features that adjust sound and Active Noise Cancellation in response to the environment around you.
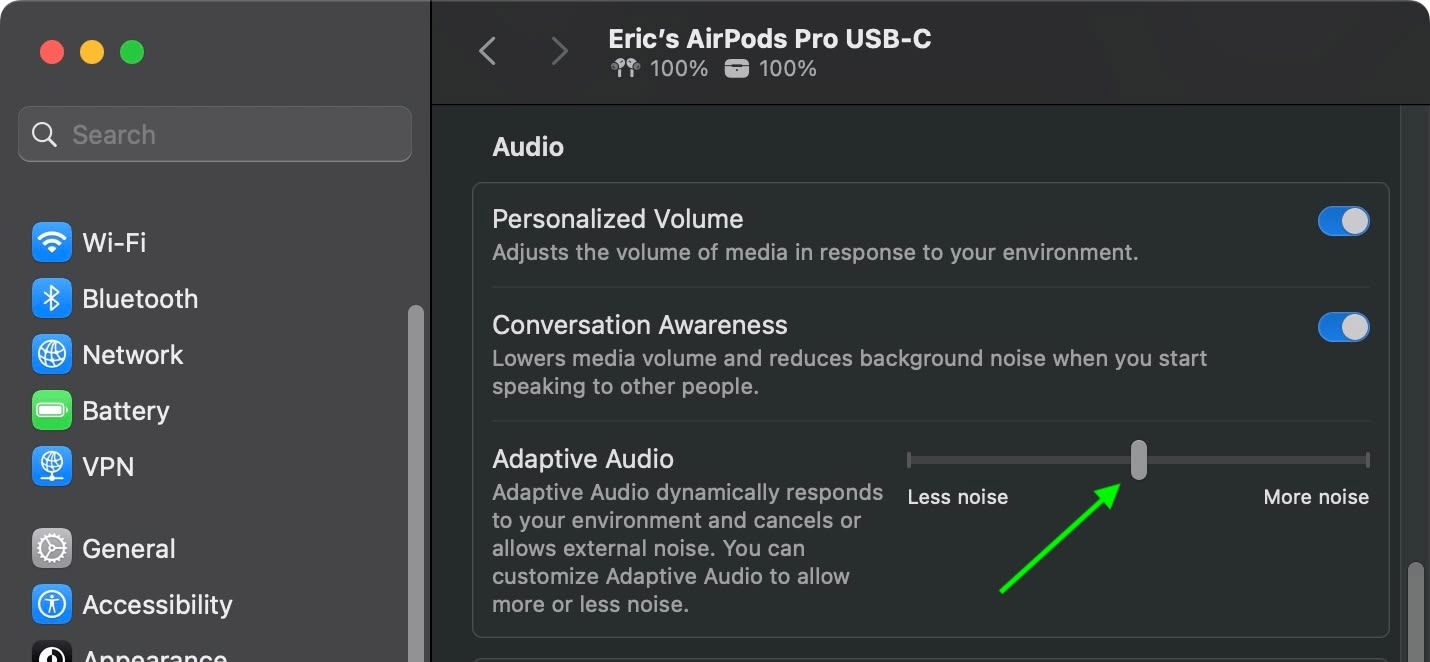
Previously, Adaptive Audio was an all or nothing setting, but that's changed in macOS Sequoia. Apple has added a "Customize Adaptive Audio" menu that lets you adjust the setting to allow for more or less noise.
4. AirPods Pro Head Gestures
With the new head gesture features, users can control Siri on the AirPods Pro with a shake or a nod of the head. If you get a phone call, for example, you can shake your head no if you don't want to answer it, or nod to accept the call. Siri interactions can be used for responding to incoming messages, calls, and notifications.
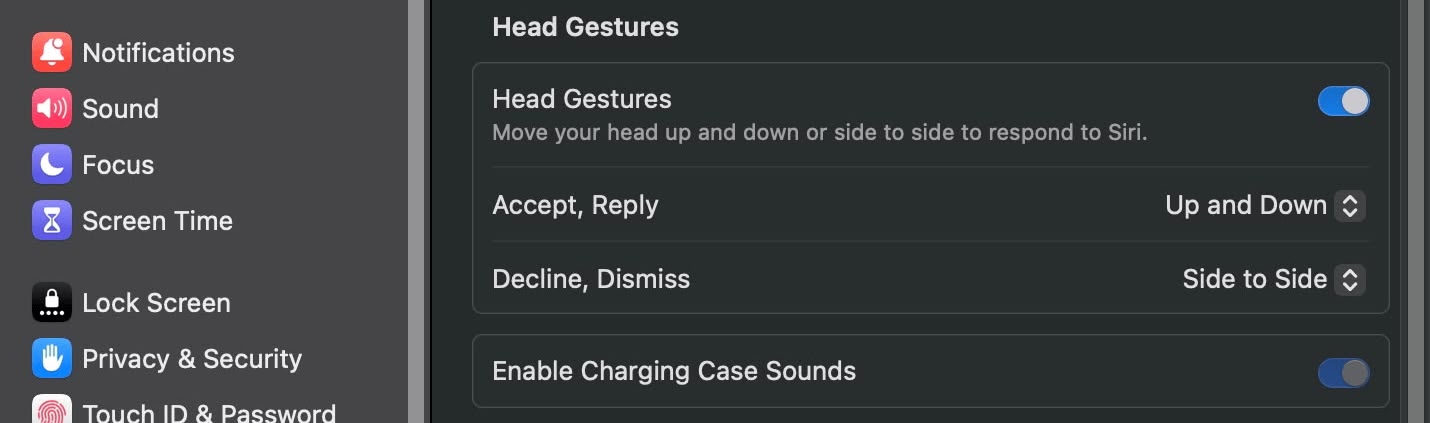
In Sequoia, Apple has added a section to the AirPods Pro menu in System Settings, enabling you to turn the gestures on and off.

Apple's
Game Porting Toolkit 2 allows developers to run unmodified Windows executables on Apple silicon Macs using the evaluation environment for Windows PC games, but end users can use it to run games too. The latest version supports an even larger set of game technologies, improved graphics and compute compatibility, ray tracing, the AVX2 instruction set, and increased performance.
6. New Dynamic Wallpapers

Sequoia features several new wallpapers, including dynamic versions. The wallpapers feature the sequoia trees that macOS Sequoia is named for. The imagery likely comes from Sequoia National Park, located in the southern Sierra Nevada mountains of California. There are three separate versions of the wallpaper for different times of day: Sequoia Sunrise, Sequoia Morning, and Sequoia Night.
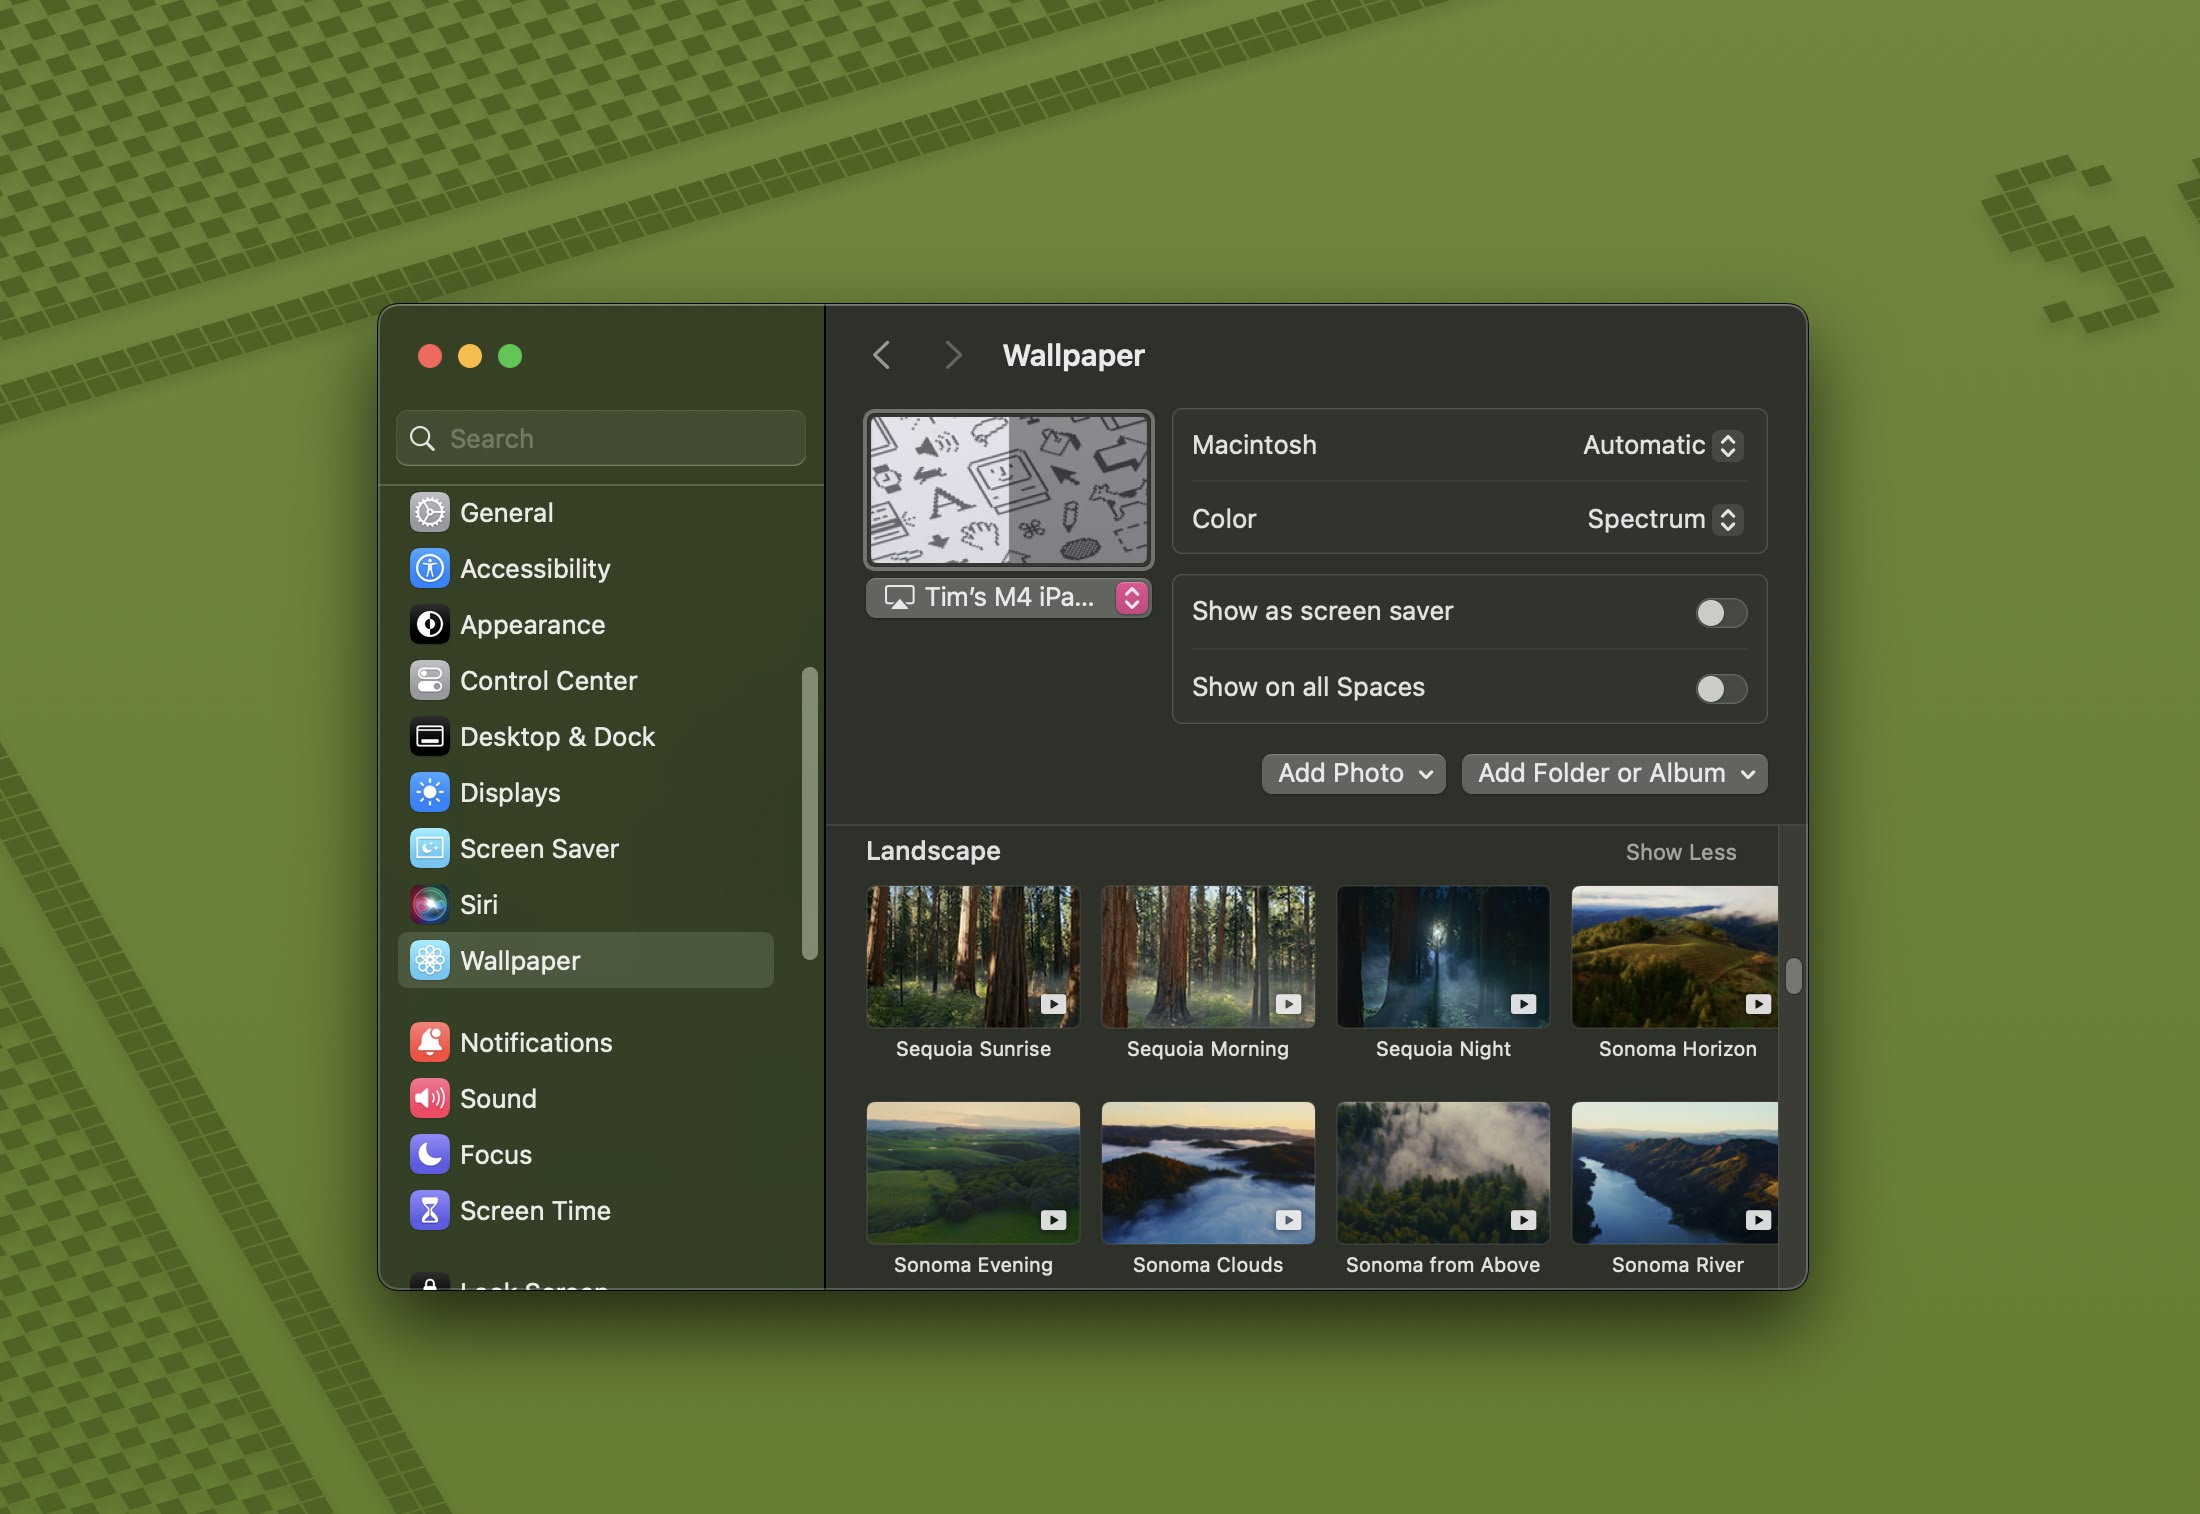
Each wallpaper is animated and will shift slightly at the Lock Screen when you unlock your Mac, plus there is an option to set it as a screen saver. There's also a fun new Macintosh dynamic wallpaper and screensaver combination that highlights classic Mac icons.
7. New Chess Graphics

Apple has significantly updated the built-in Chess app in macOS Sequoia, marking its first major overhaul since macOS 10.3 in 2003. While not typically frequently used, the Chess app has received a substantial visual upgrade. It now boasts improved textures, lighting effects, and rendering for both the board and pieces. Users can also enjoy new aesthetic options with wood, metal, and marble skins for the game elements. Despite these enhancements, Apple has ensured backwards compatibility allowing users to access and continue their previously saved games in the new version.
8. Safari Video Viewer
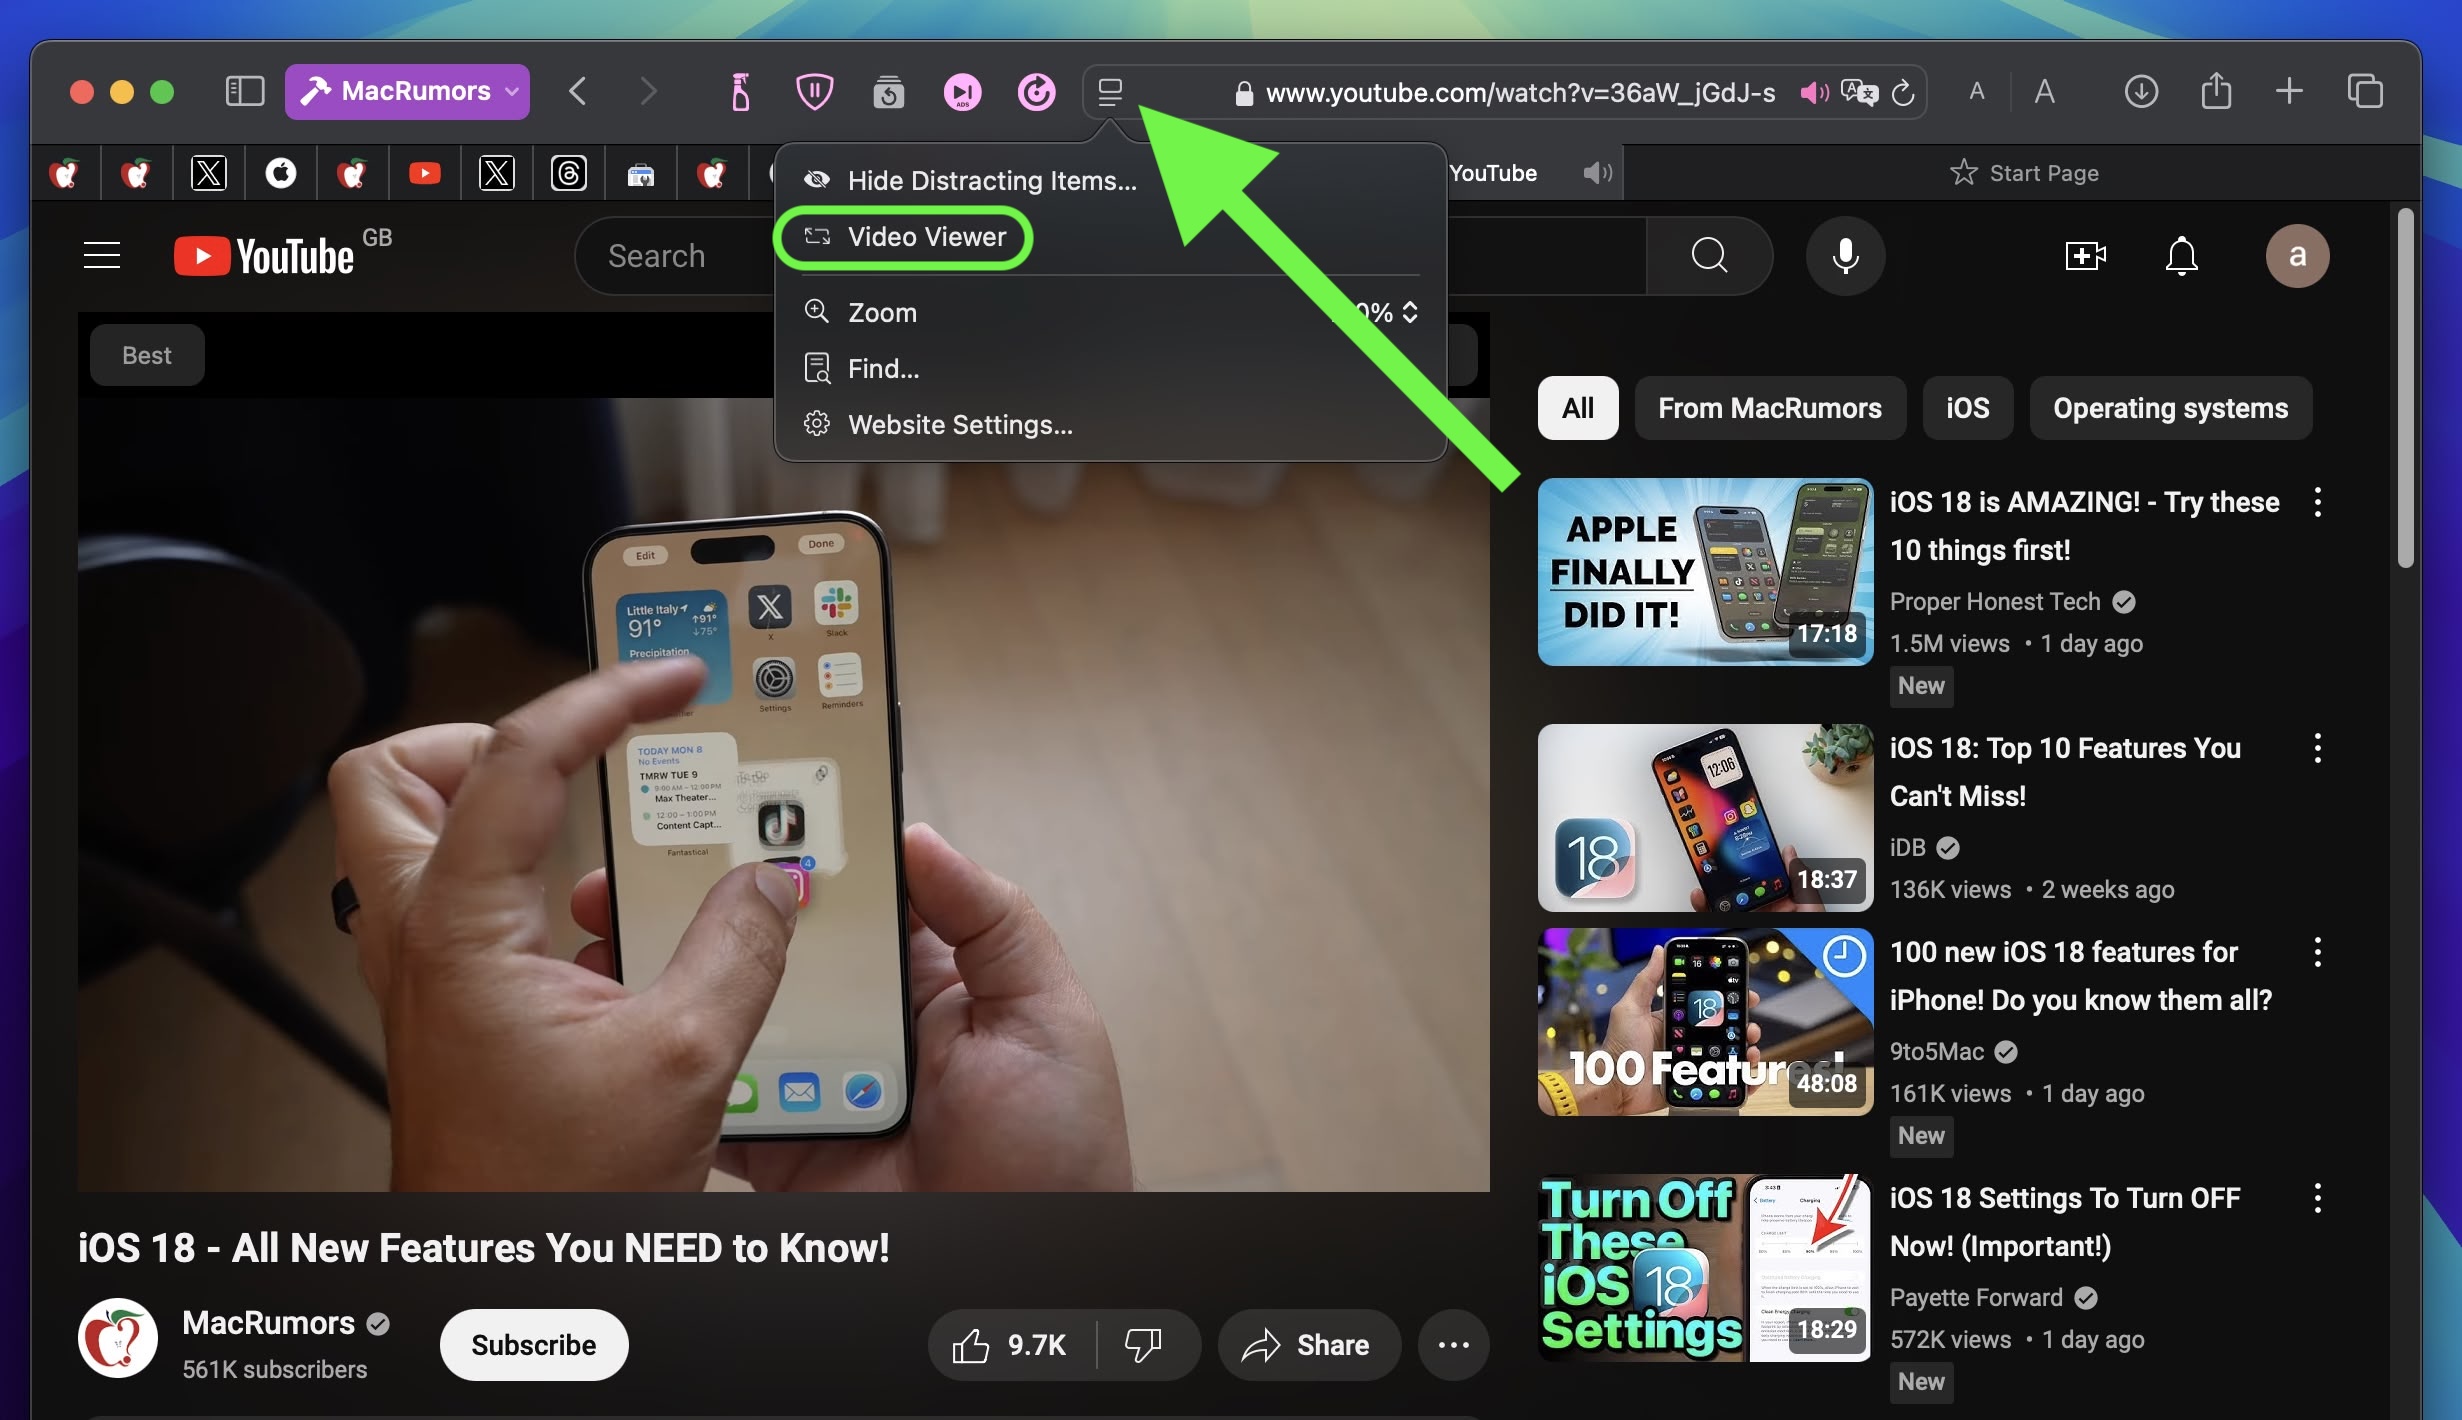
When watching a video in Safari, click the menu icon in the left-hand side of the address bar and select the new Video Viewer option. This makes the playing video expand within the Safari window into a kind of theater mode that blurs everything out behind it, bringing the content front and center.
It also includes a native playback controls interface that replaces YouTube's – or the UI of whatever video you are playing. Options include AirPlay, volume, Picture in Picture, and playback speed.
9. Move & Resize Windows Controls
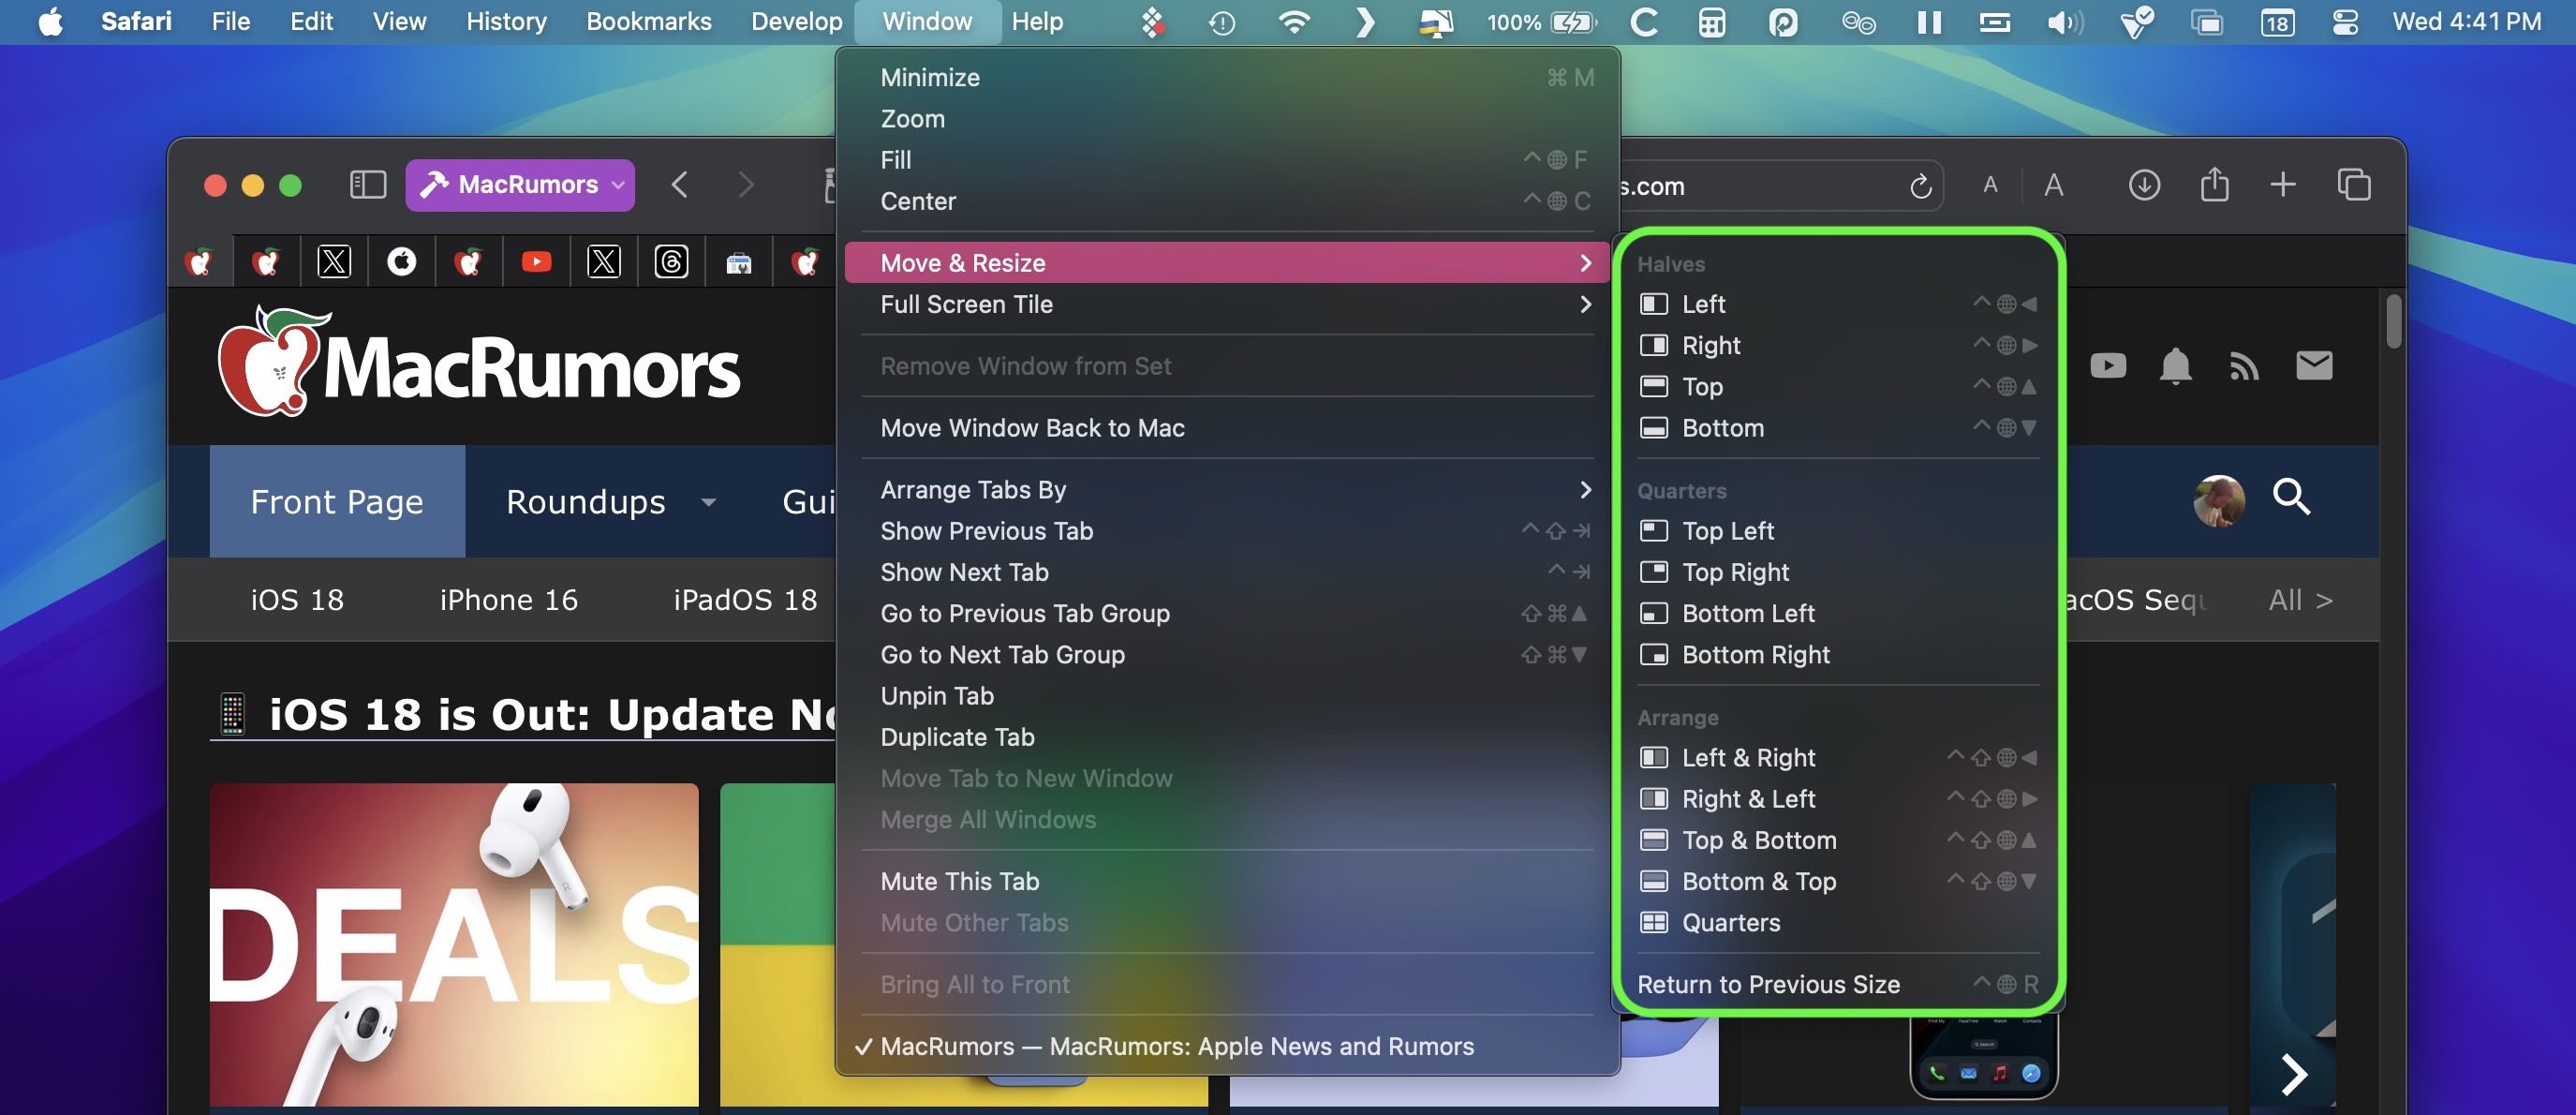
Accessed from the menu bar, a new "Move & Resize" option in the Window menu allows you to easily manage and arrange windows on your screen by offering various tiling and resizing options. You can move a window to the top, bottom, left, or right half of the screen, or position it into one of the four corners if you prefer a quarter-screen layout.
macOS also provides more flexible arrangements, such as splitting the screen horizontally or vertically, where you can tile windows side by side or one above the other. For even more control, there's a feature to quickly return a window to its previous size and position, making it easy to undo any changes.
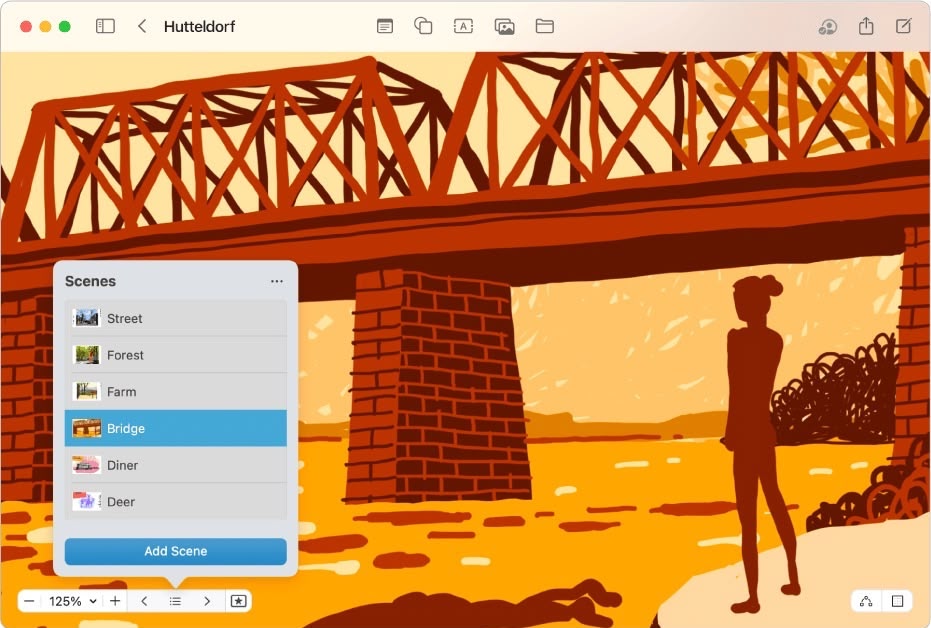
In the Freeform app, Apple has introduced "scenes" to make it easier to navigate and present Freeform boards. Scenes are saved views of specific sections of your board, offering a versatile way to organize and present your work. By creating scenes, you can divide your board into distinct, labeled sections, making it easier to navigate through complex content.
To create a scene, open a board with content, then zoom and scroll until you frame the part of your board you want on the screen for your first scene. Then click the three bullets icon and click Add Scene. Simply repeat these steps until you capture all the scenes you want.
11. Collapse Sections in Notes
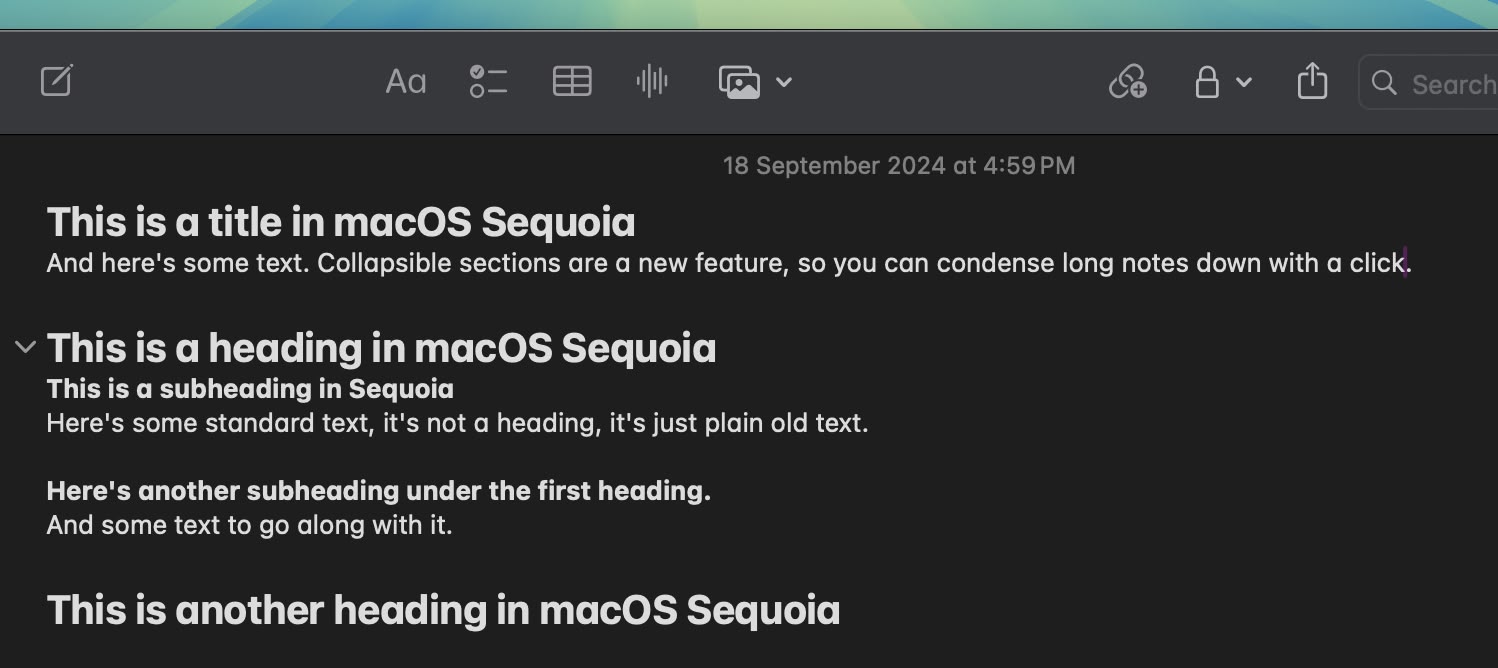
In the Notes app, if you have long notes with multiple headings, you can now collapse those headings down to create a more compact note.
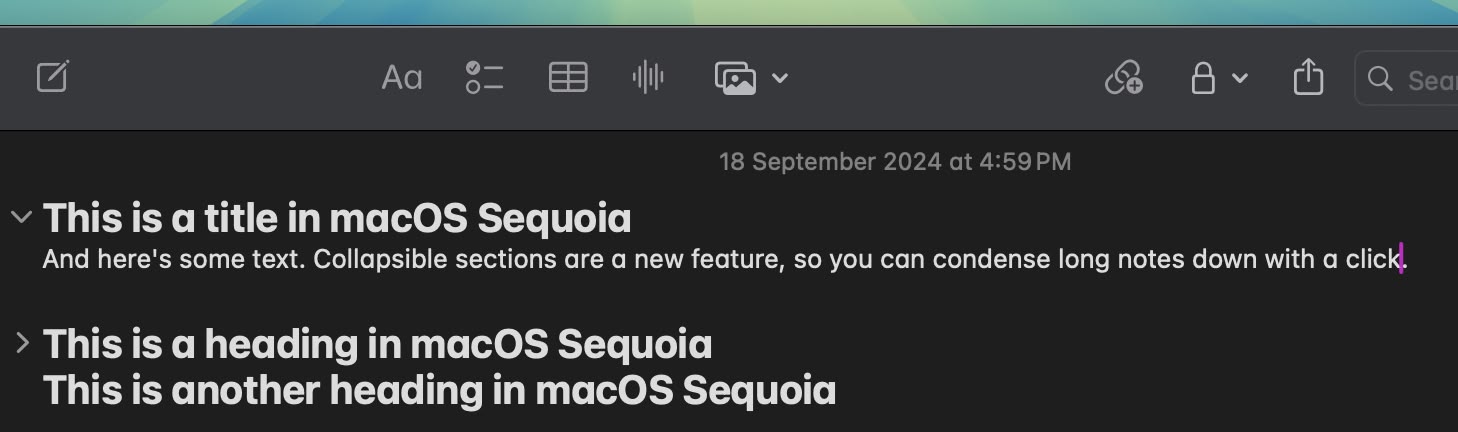
Any section header can be collapsed, including headings, subheadings, and titles. Just click on a heading and then click on the down arrow to collapse it. Click the arrow again to open it up.
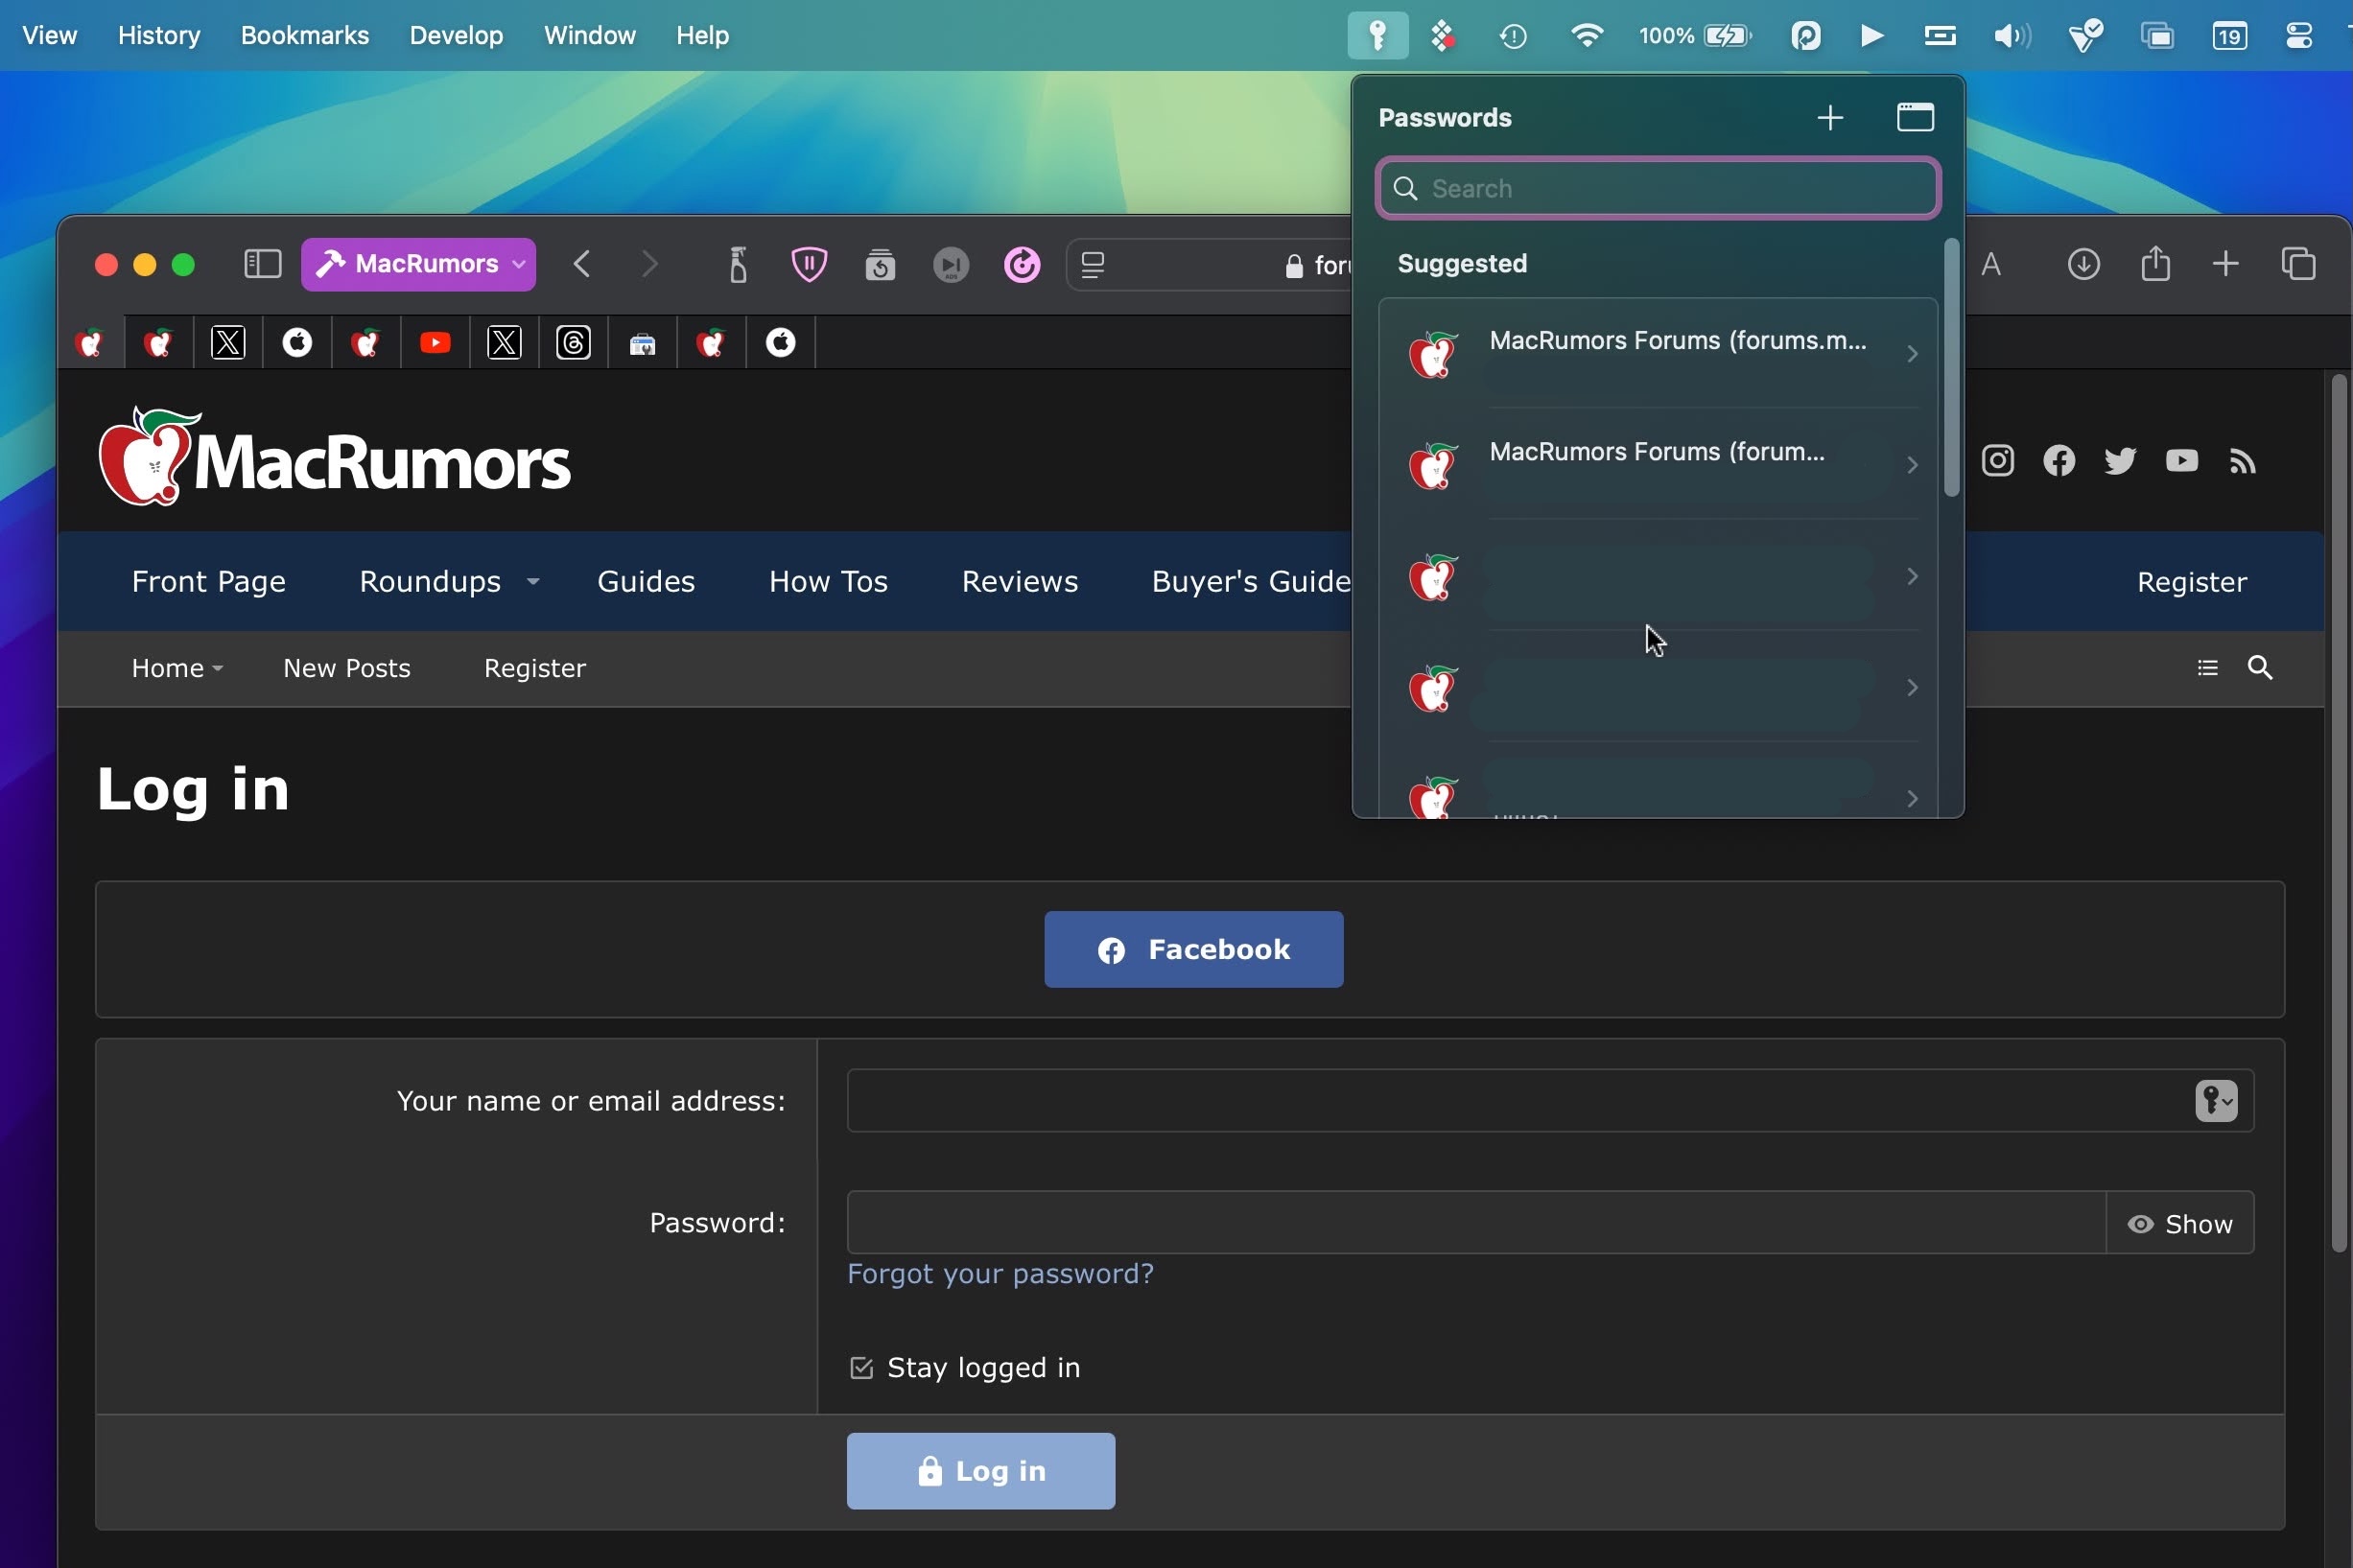
12. New Passwords App
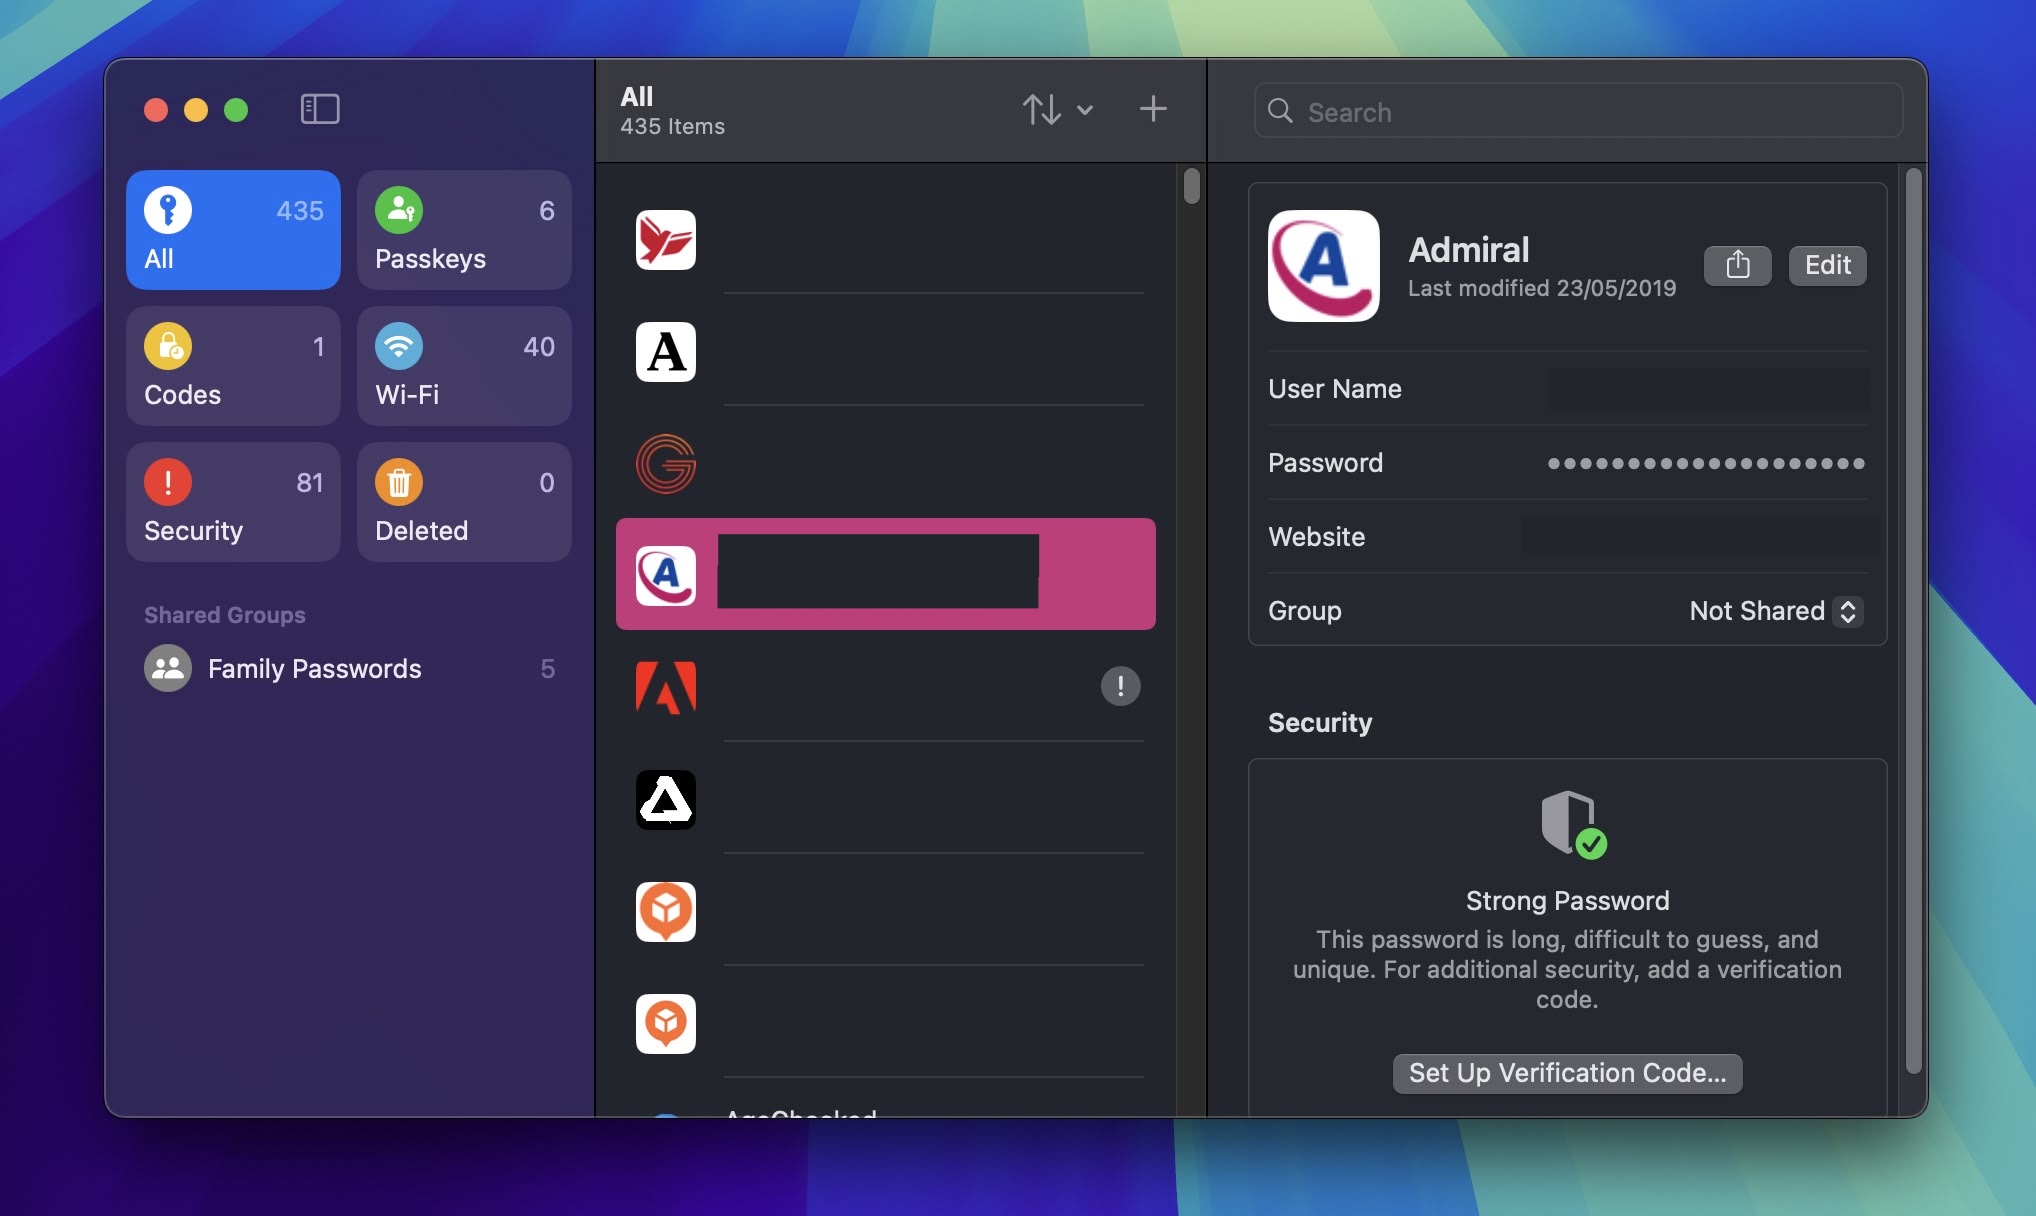
Apple added a dedicated Passwords app in macOS Sequoia, where logins and passwords stored in iCloud Keychain can be accessed. It's essentially the Passwords section that used to be located in Safari's settings, but in a dedicated app that makes it easier to find your stored login information.
The app has a simple layout with a search bar in the top-right of the window, so you can look up the information that you're looking for. If you've already used the iCloud Keychain feature, all of your saved logins and passwords are ready to go as soon as you authenticate with Touch ID or your Mac password. There are separate sections for passwords and logins (under All), Passkeys, two-factor authentication codes, Wi-Fi passwords, security warnings, and logins that have been deleted.
You can click in to any of the sections to see what's listed there, and selecting an individual entry shows the login and password. Each entry has fields for site or app name, username, login, verification code, websites where the login is used, and notes. There's also an option for changing your password for any given entry.
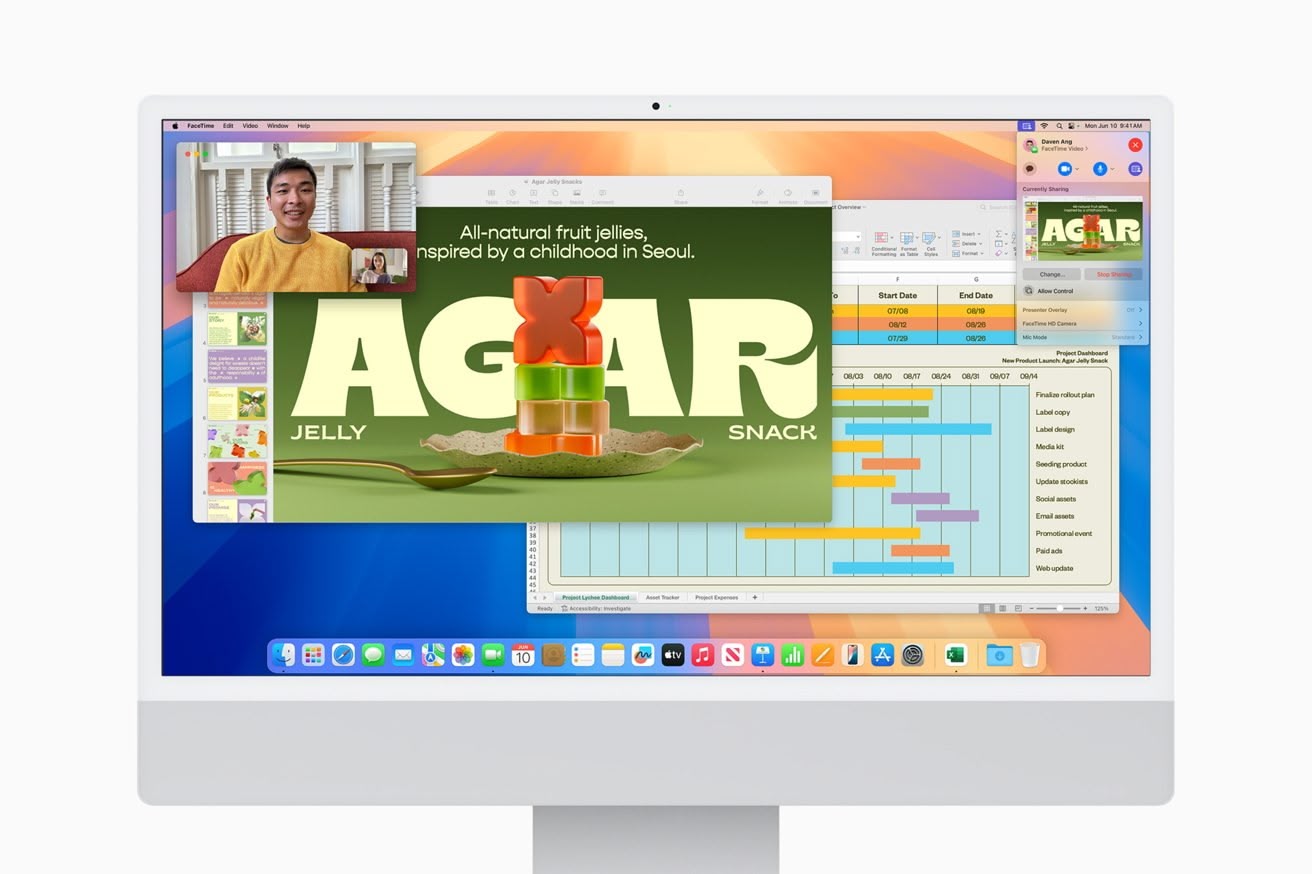
13. iPhone Mirroring
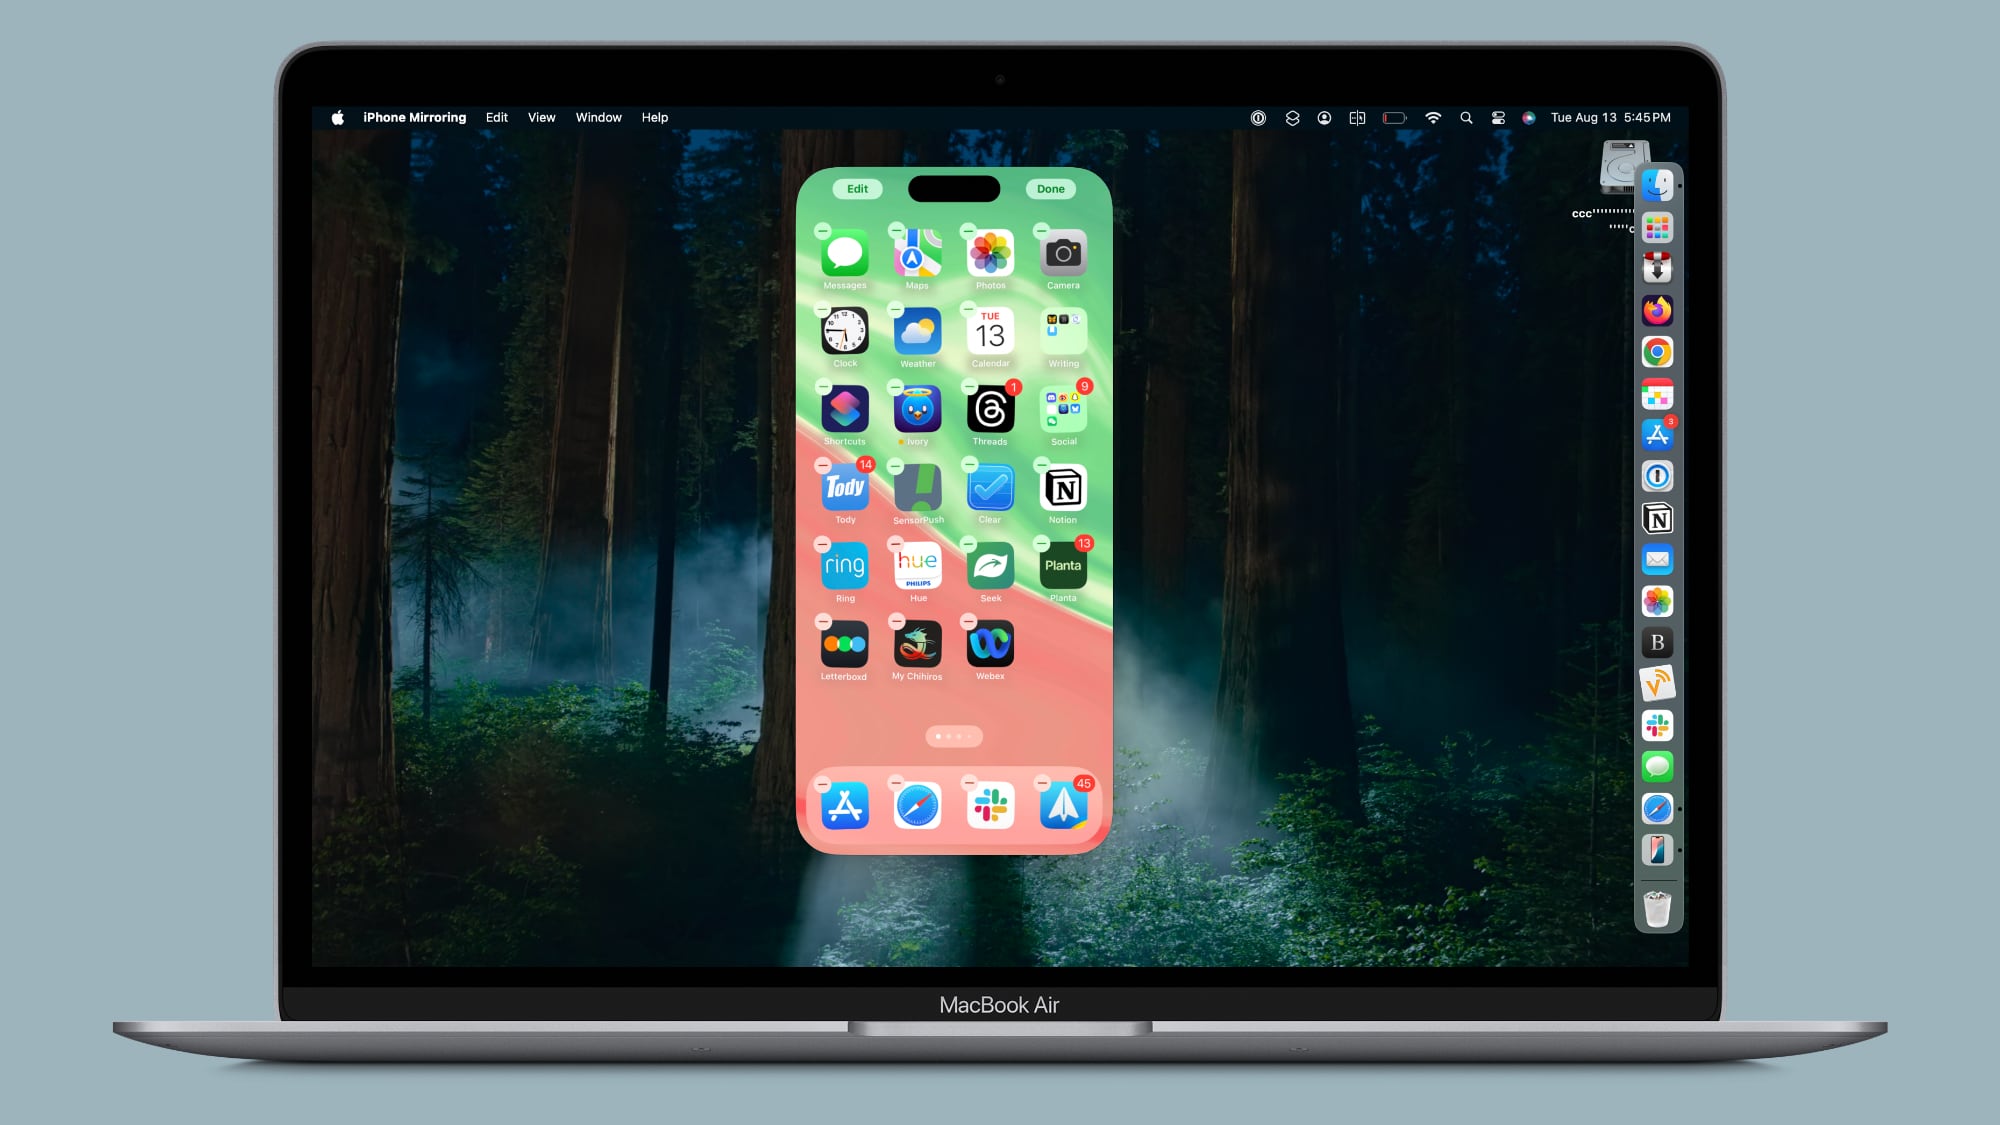
Apple has added support for iPhone Mirroring, one of the main updates coming to the Mac. iPhone Mirroring is a Continuity feature that lets you control your iPhone from your Mac. When you're signed in to the same Apple Account on a Mac and an iPhone, you can use iPhone Mirroring to interact with your iPhone even when the iPhone is locked. You can open up and use apps, deal with notifications, send messages, and more.
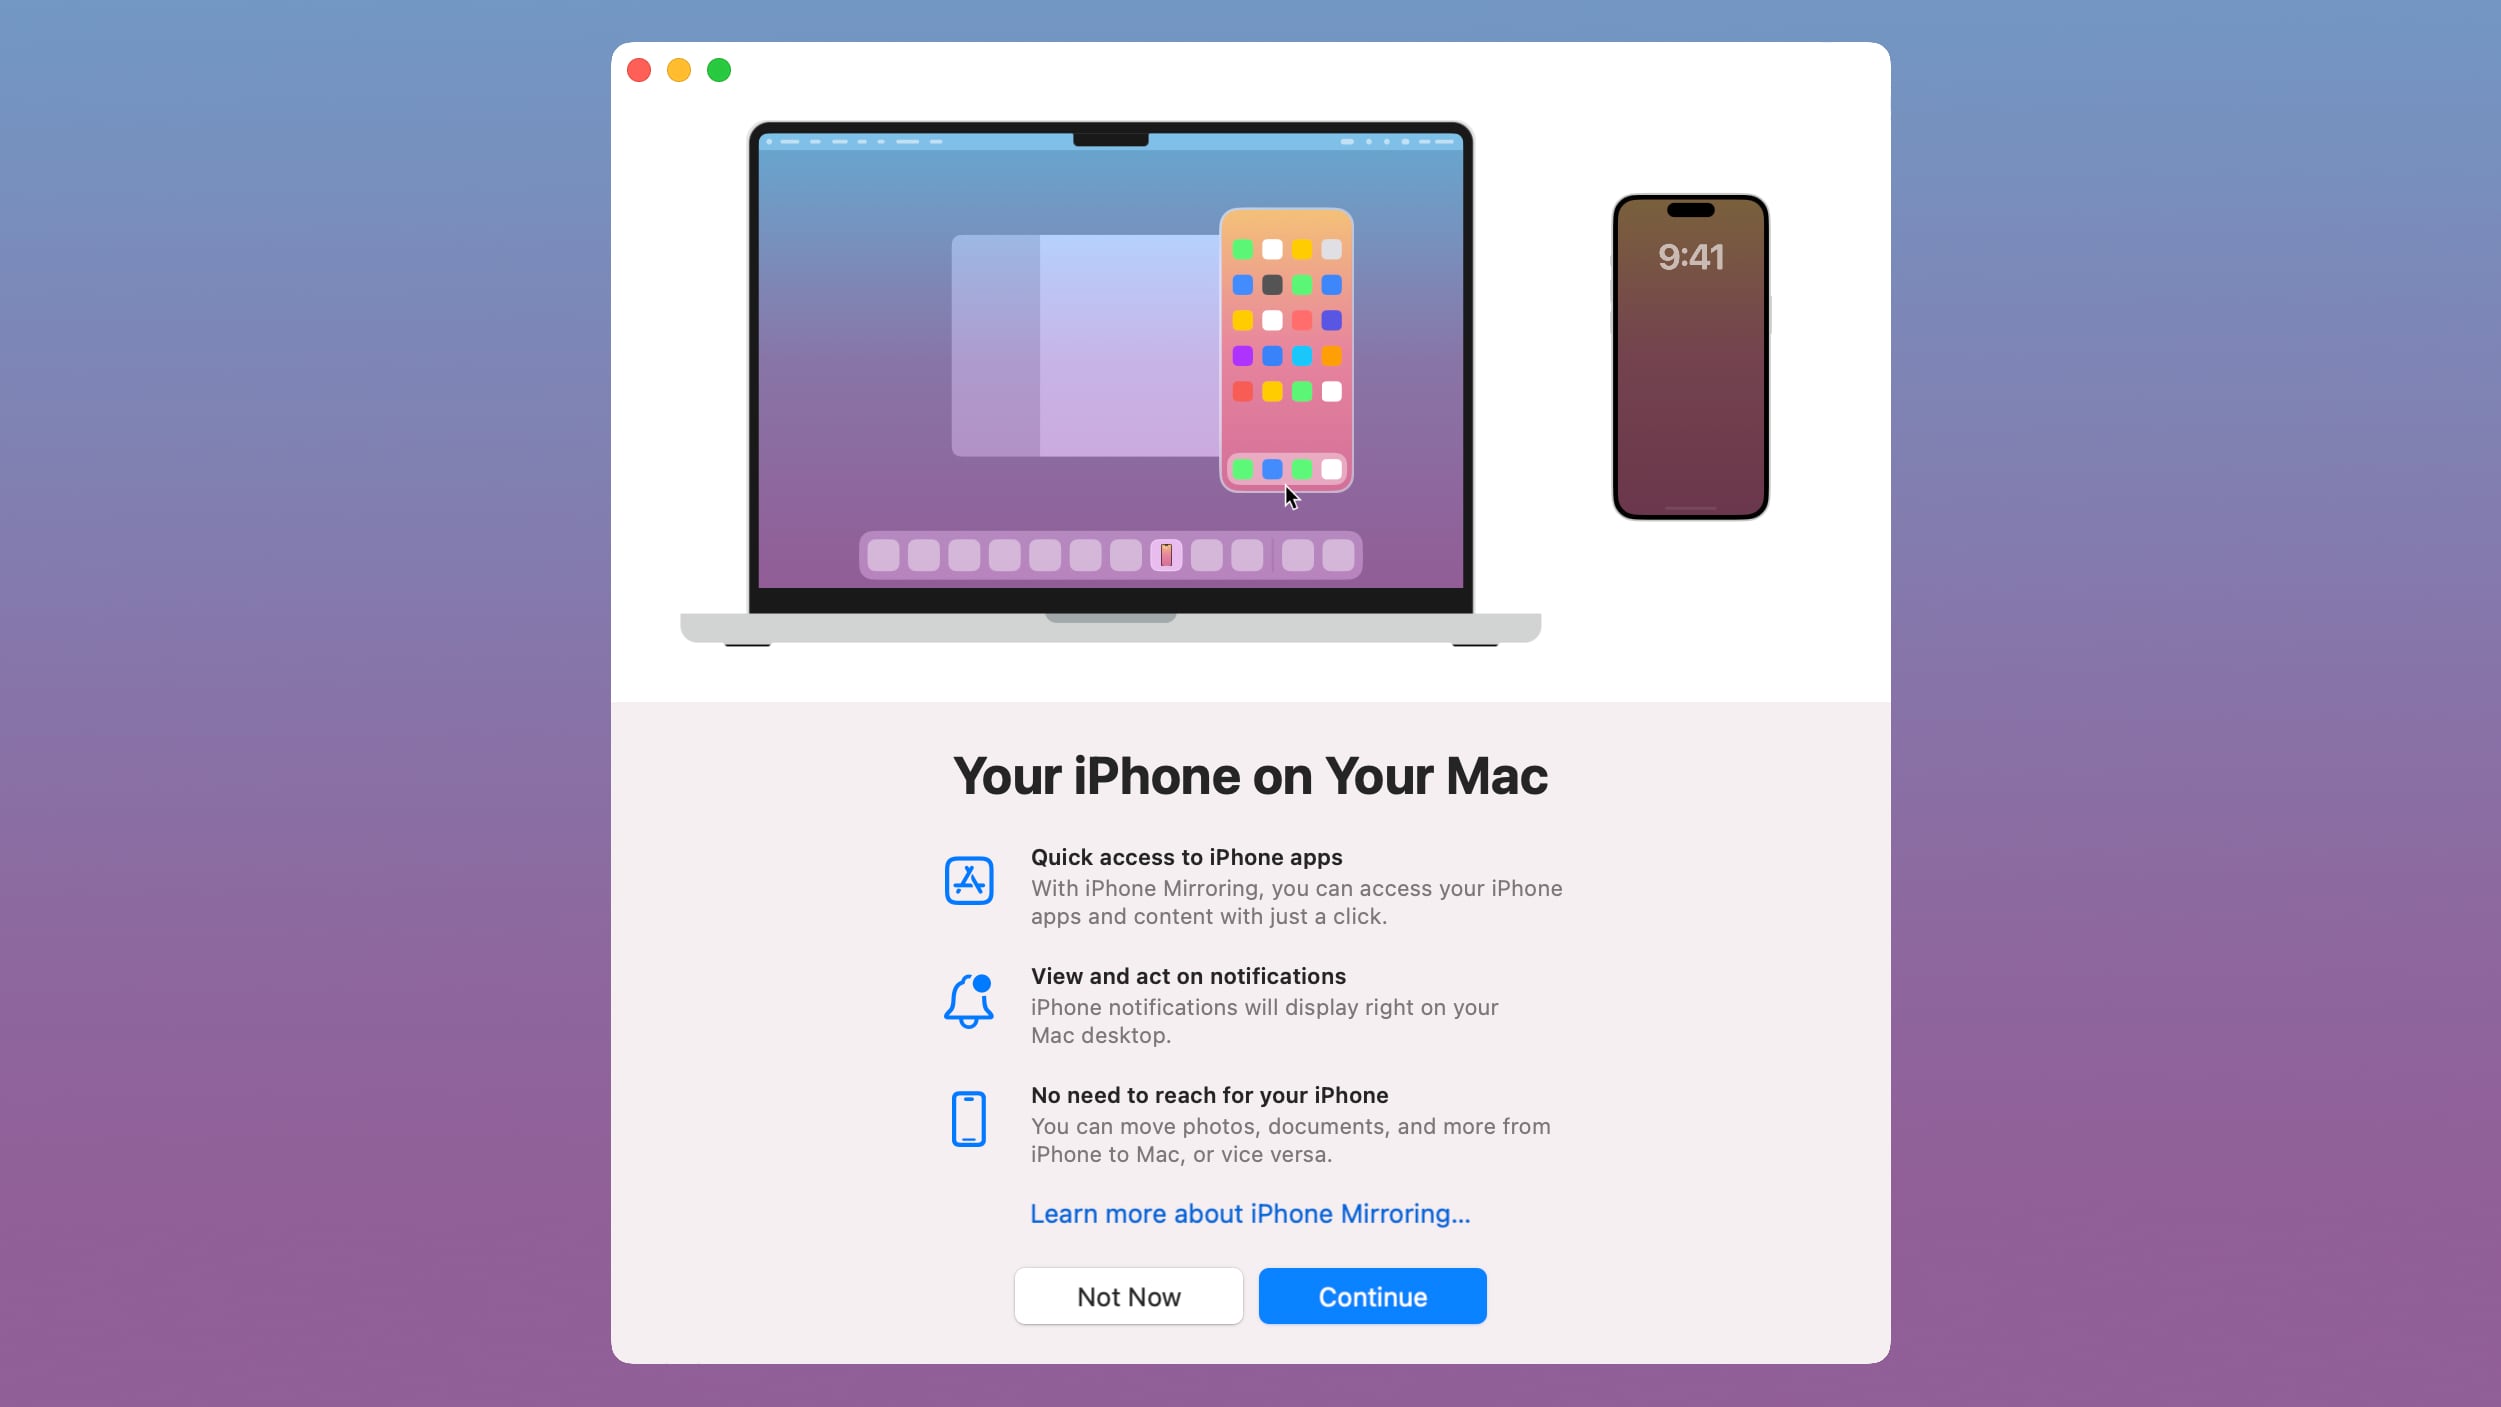
You can use your Mac keyboard, trackpad, or mouse with your iPhone, which is useful for typing up long emails and other documents on the iPhone, and it provides an easy way to keep up with your iPhone notifications without having to pull out your device and check it. When you click on a notification on your Mac when using iPhone Mirroring, it is supposed to open up right into the app on your iPhone.
In a future update, iPhone Mirroring will allow files, photos, and videos to be dragged and dropped between your iPhone and Mac and vice versa.
14. Screen Recording Permissions
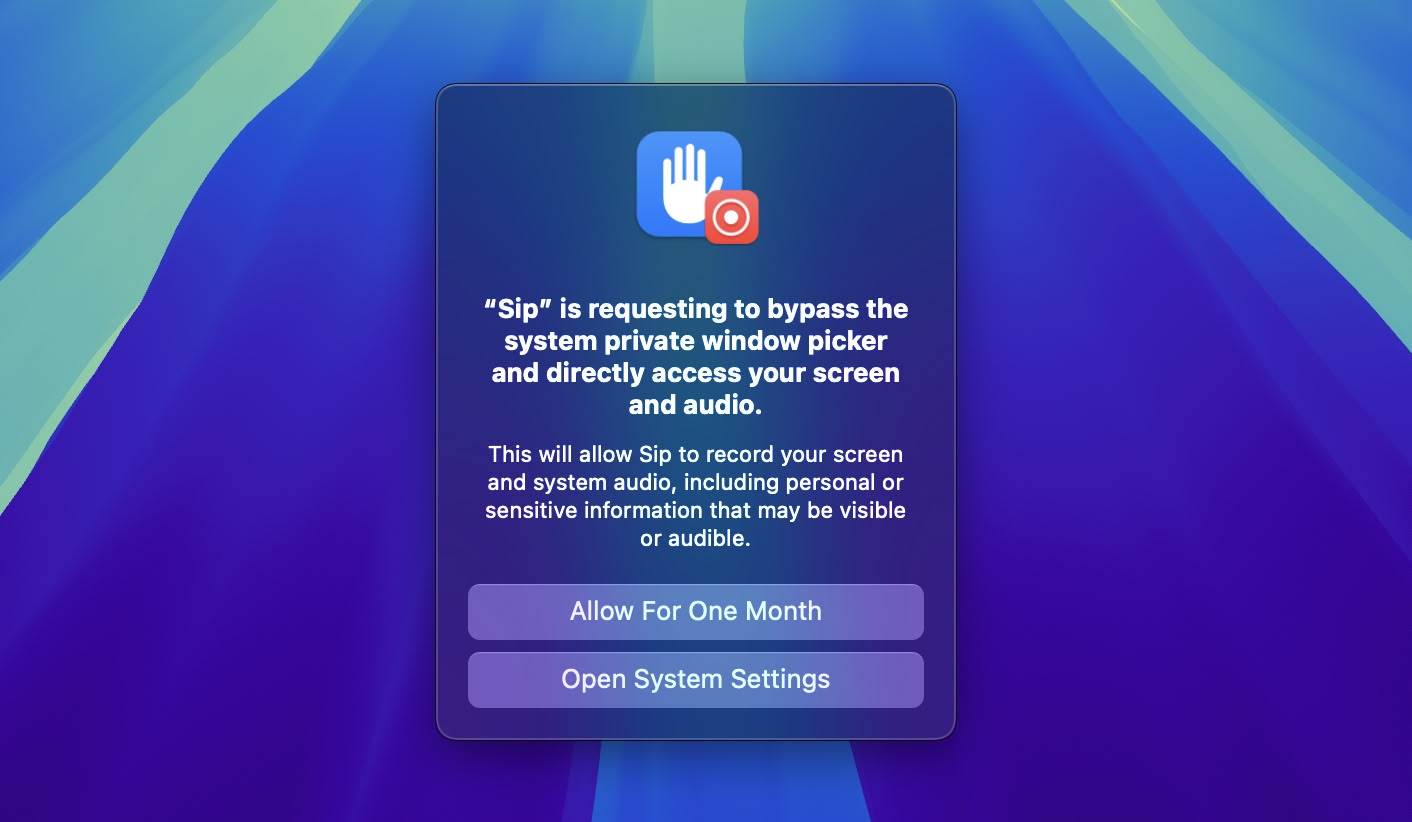
If you use an app that can record or share your screen, a new permissions popup will appear that allows you to permit access for one month. You'll encounter the same popup for the same app on a monthly basis, as part of Apple's efforts to improve macOS security measures.
15. iPhone Notifications
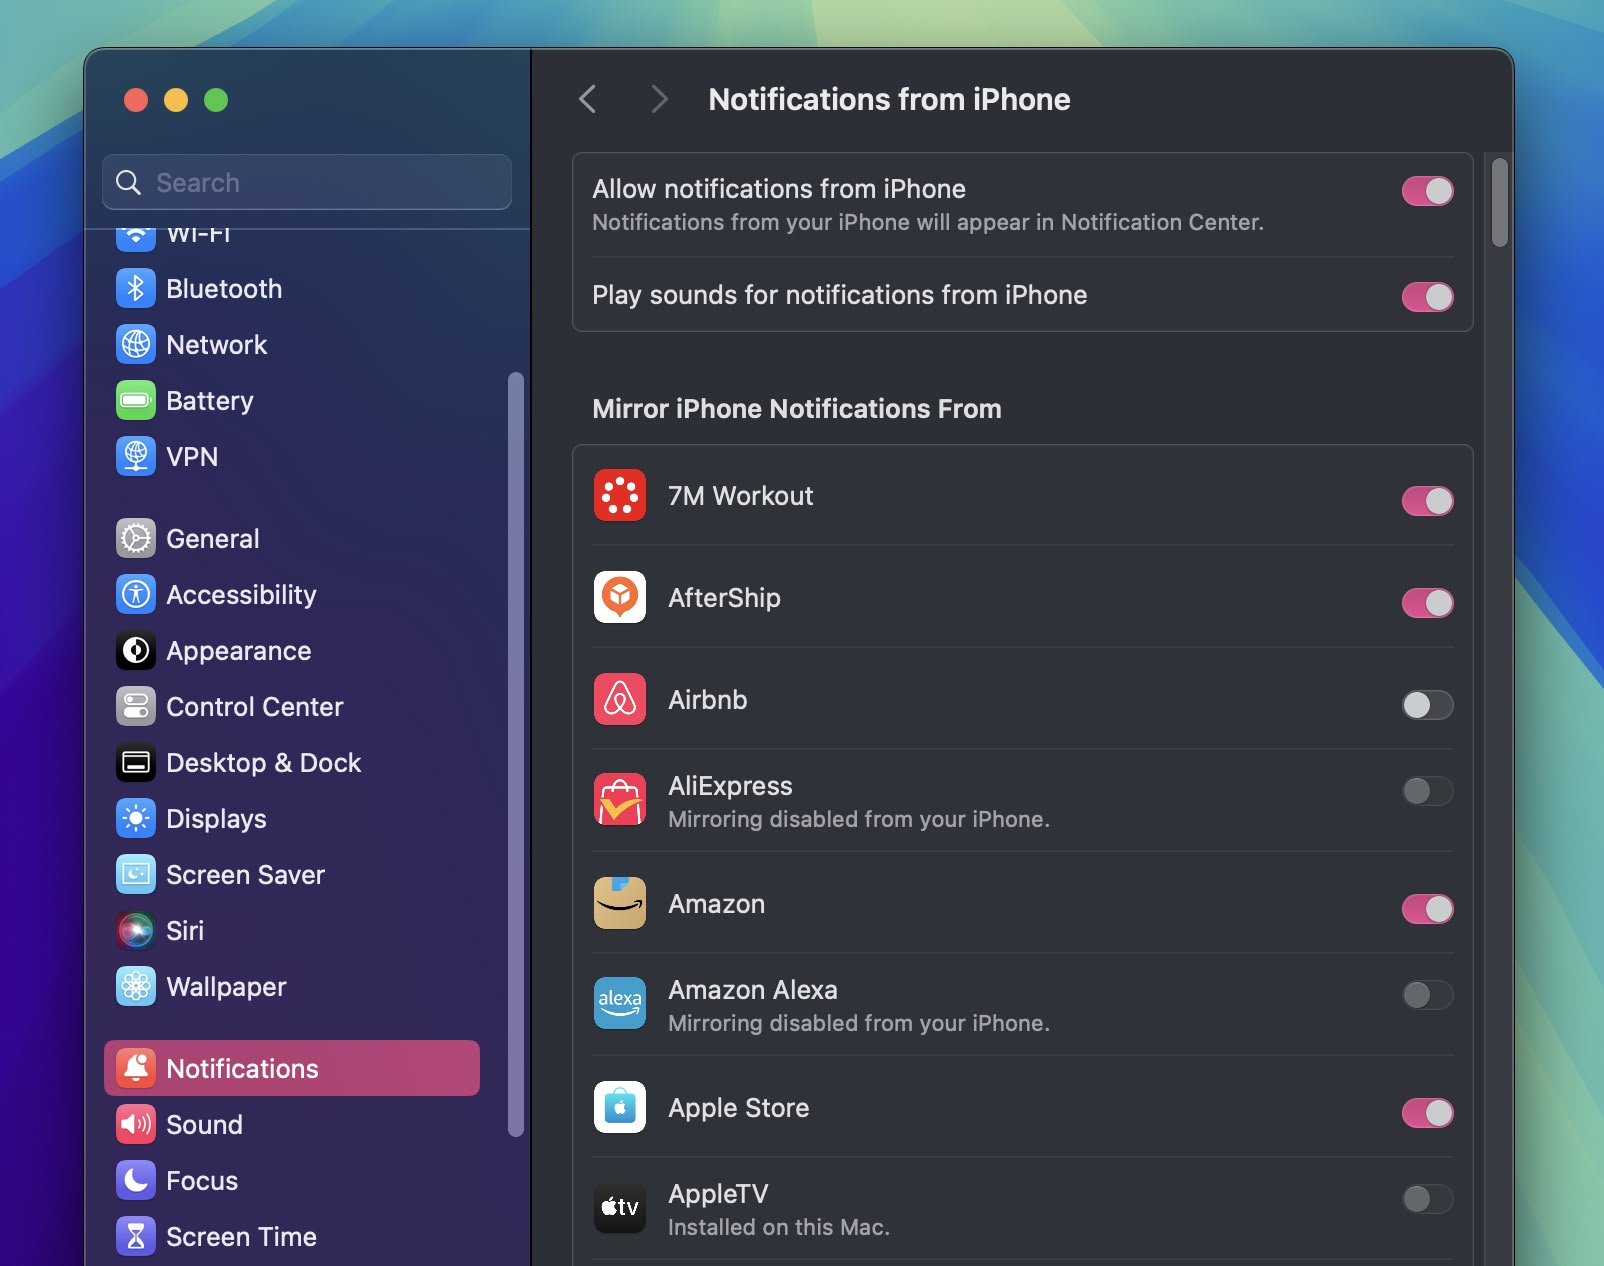
In System Settings ➝ Notifications, there's an "Allow notifications from iPhone" menu that gives you several options. These include options to enable or disable sounds for notifications from iPhone, select which specific app notifications to mirror, and turn the entire feature on and off.
If you want to make access to the new Passwords app a lot more convenient, go to Passwords ➝ Settings... and check the box next to "Show Passwords in Menu Bar." When you're next on a website in Safari that you have login credentials for, click the key icon in the menu bar, and you'll see the dropdown menu automatically detect which login details you're looking for, ready for you to select. This also works with other browsers that have the iCloud Passwords browser extension installed.
17. Highlight Text in Notes
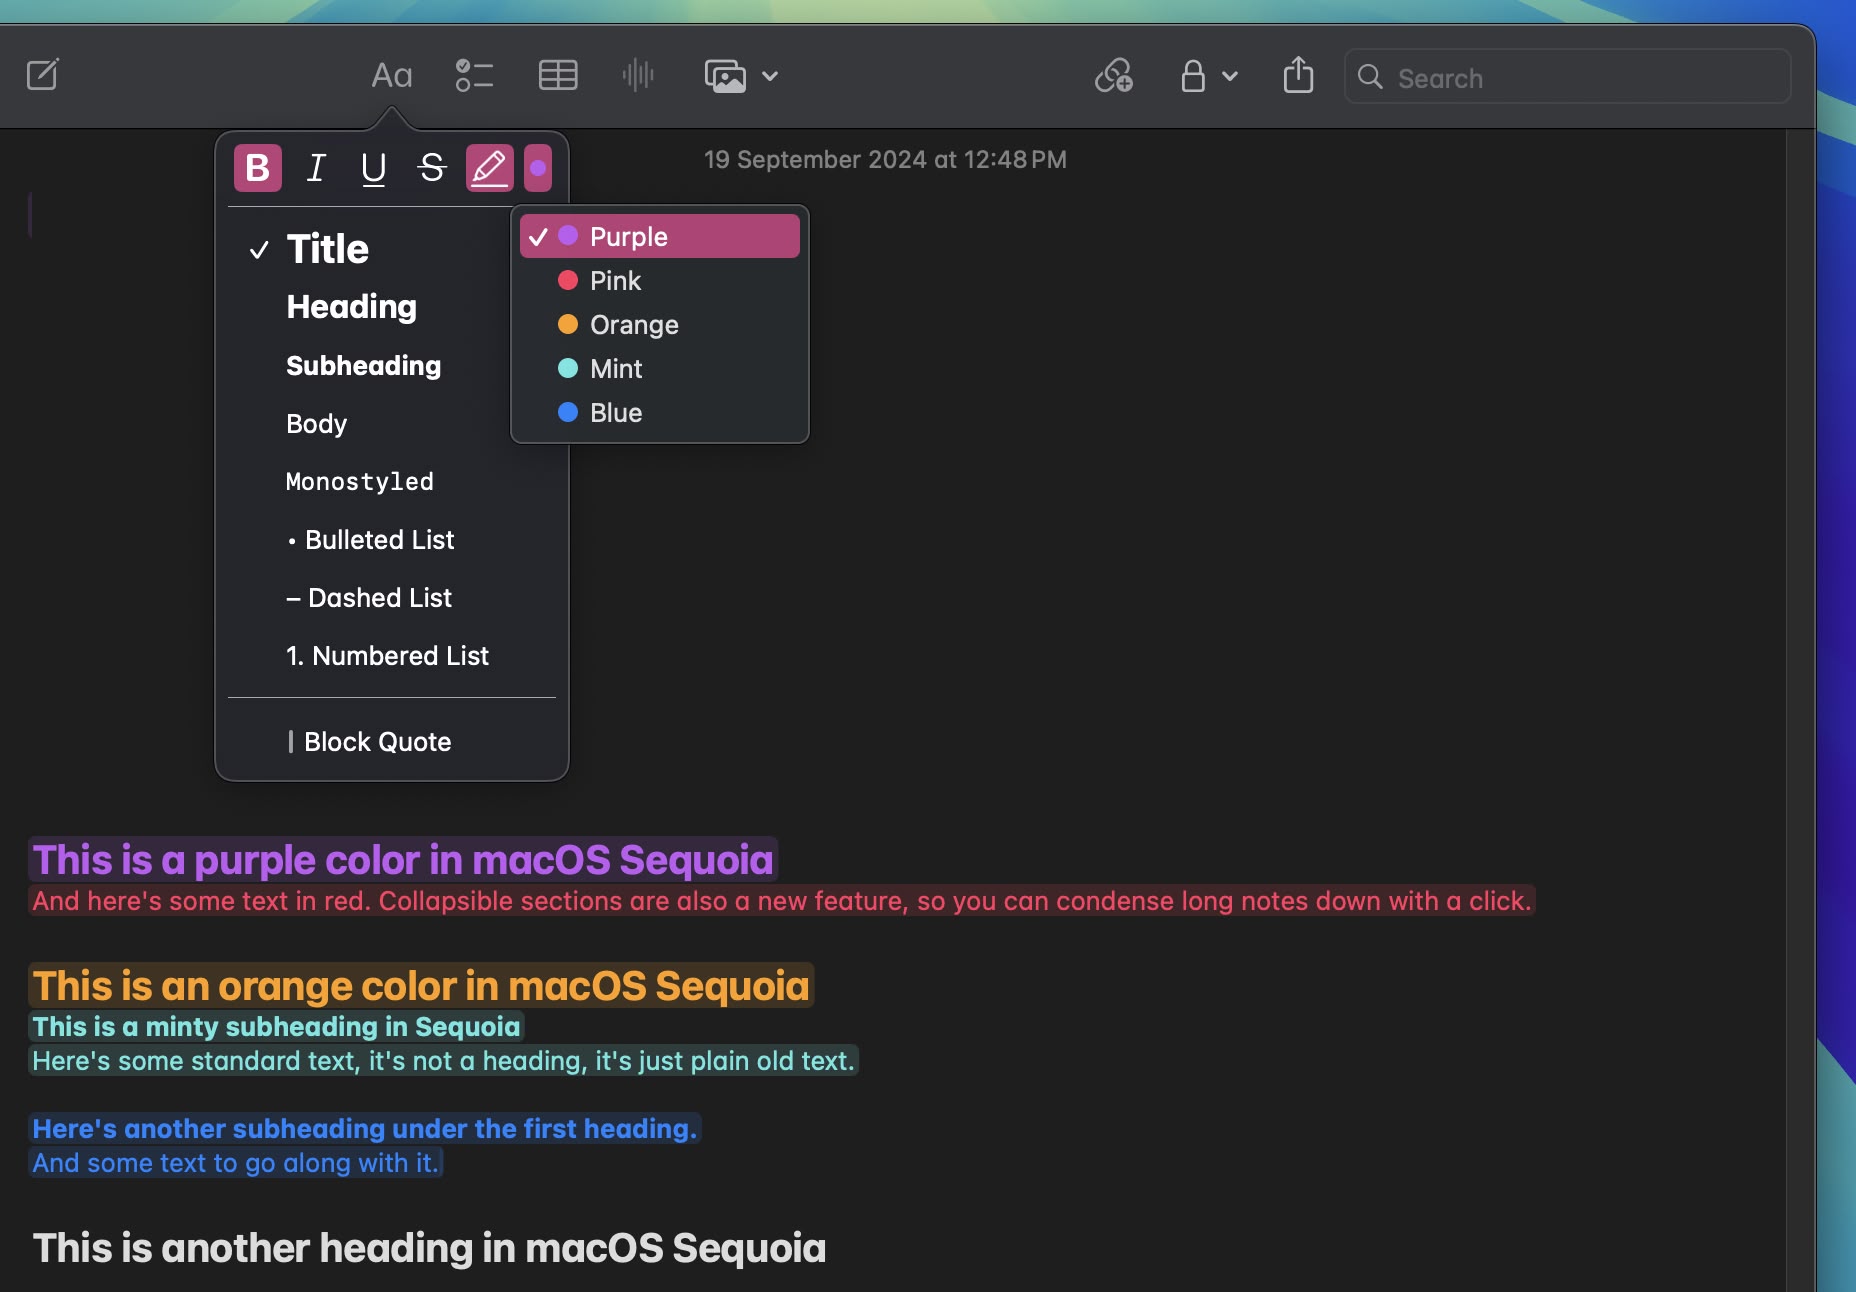
The Notes app now supports colors for typed text, allowing for highlighting. Apple added five colors, including pink, purple, orange, mint, and blue, with the colors able to be added through the formatting interface. Simply click on the
Aa button to get to the color options when a word or phrase is selected.
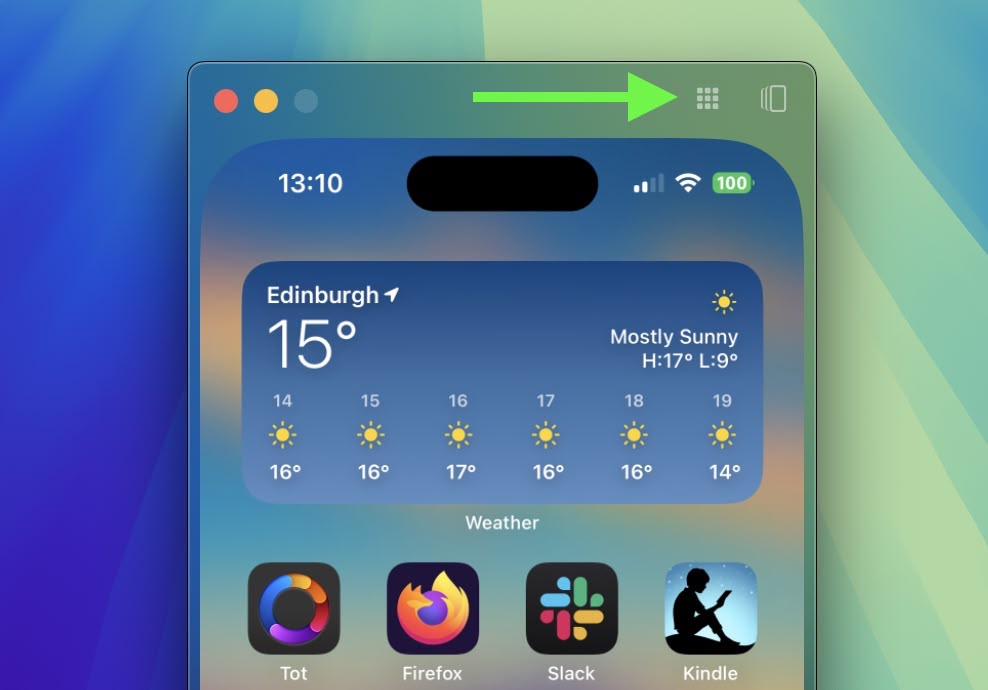
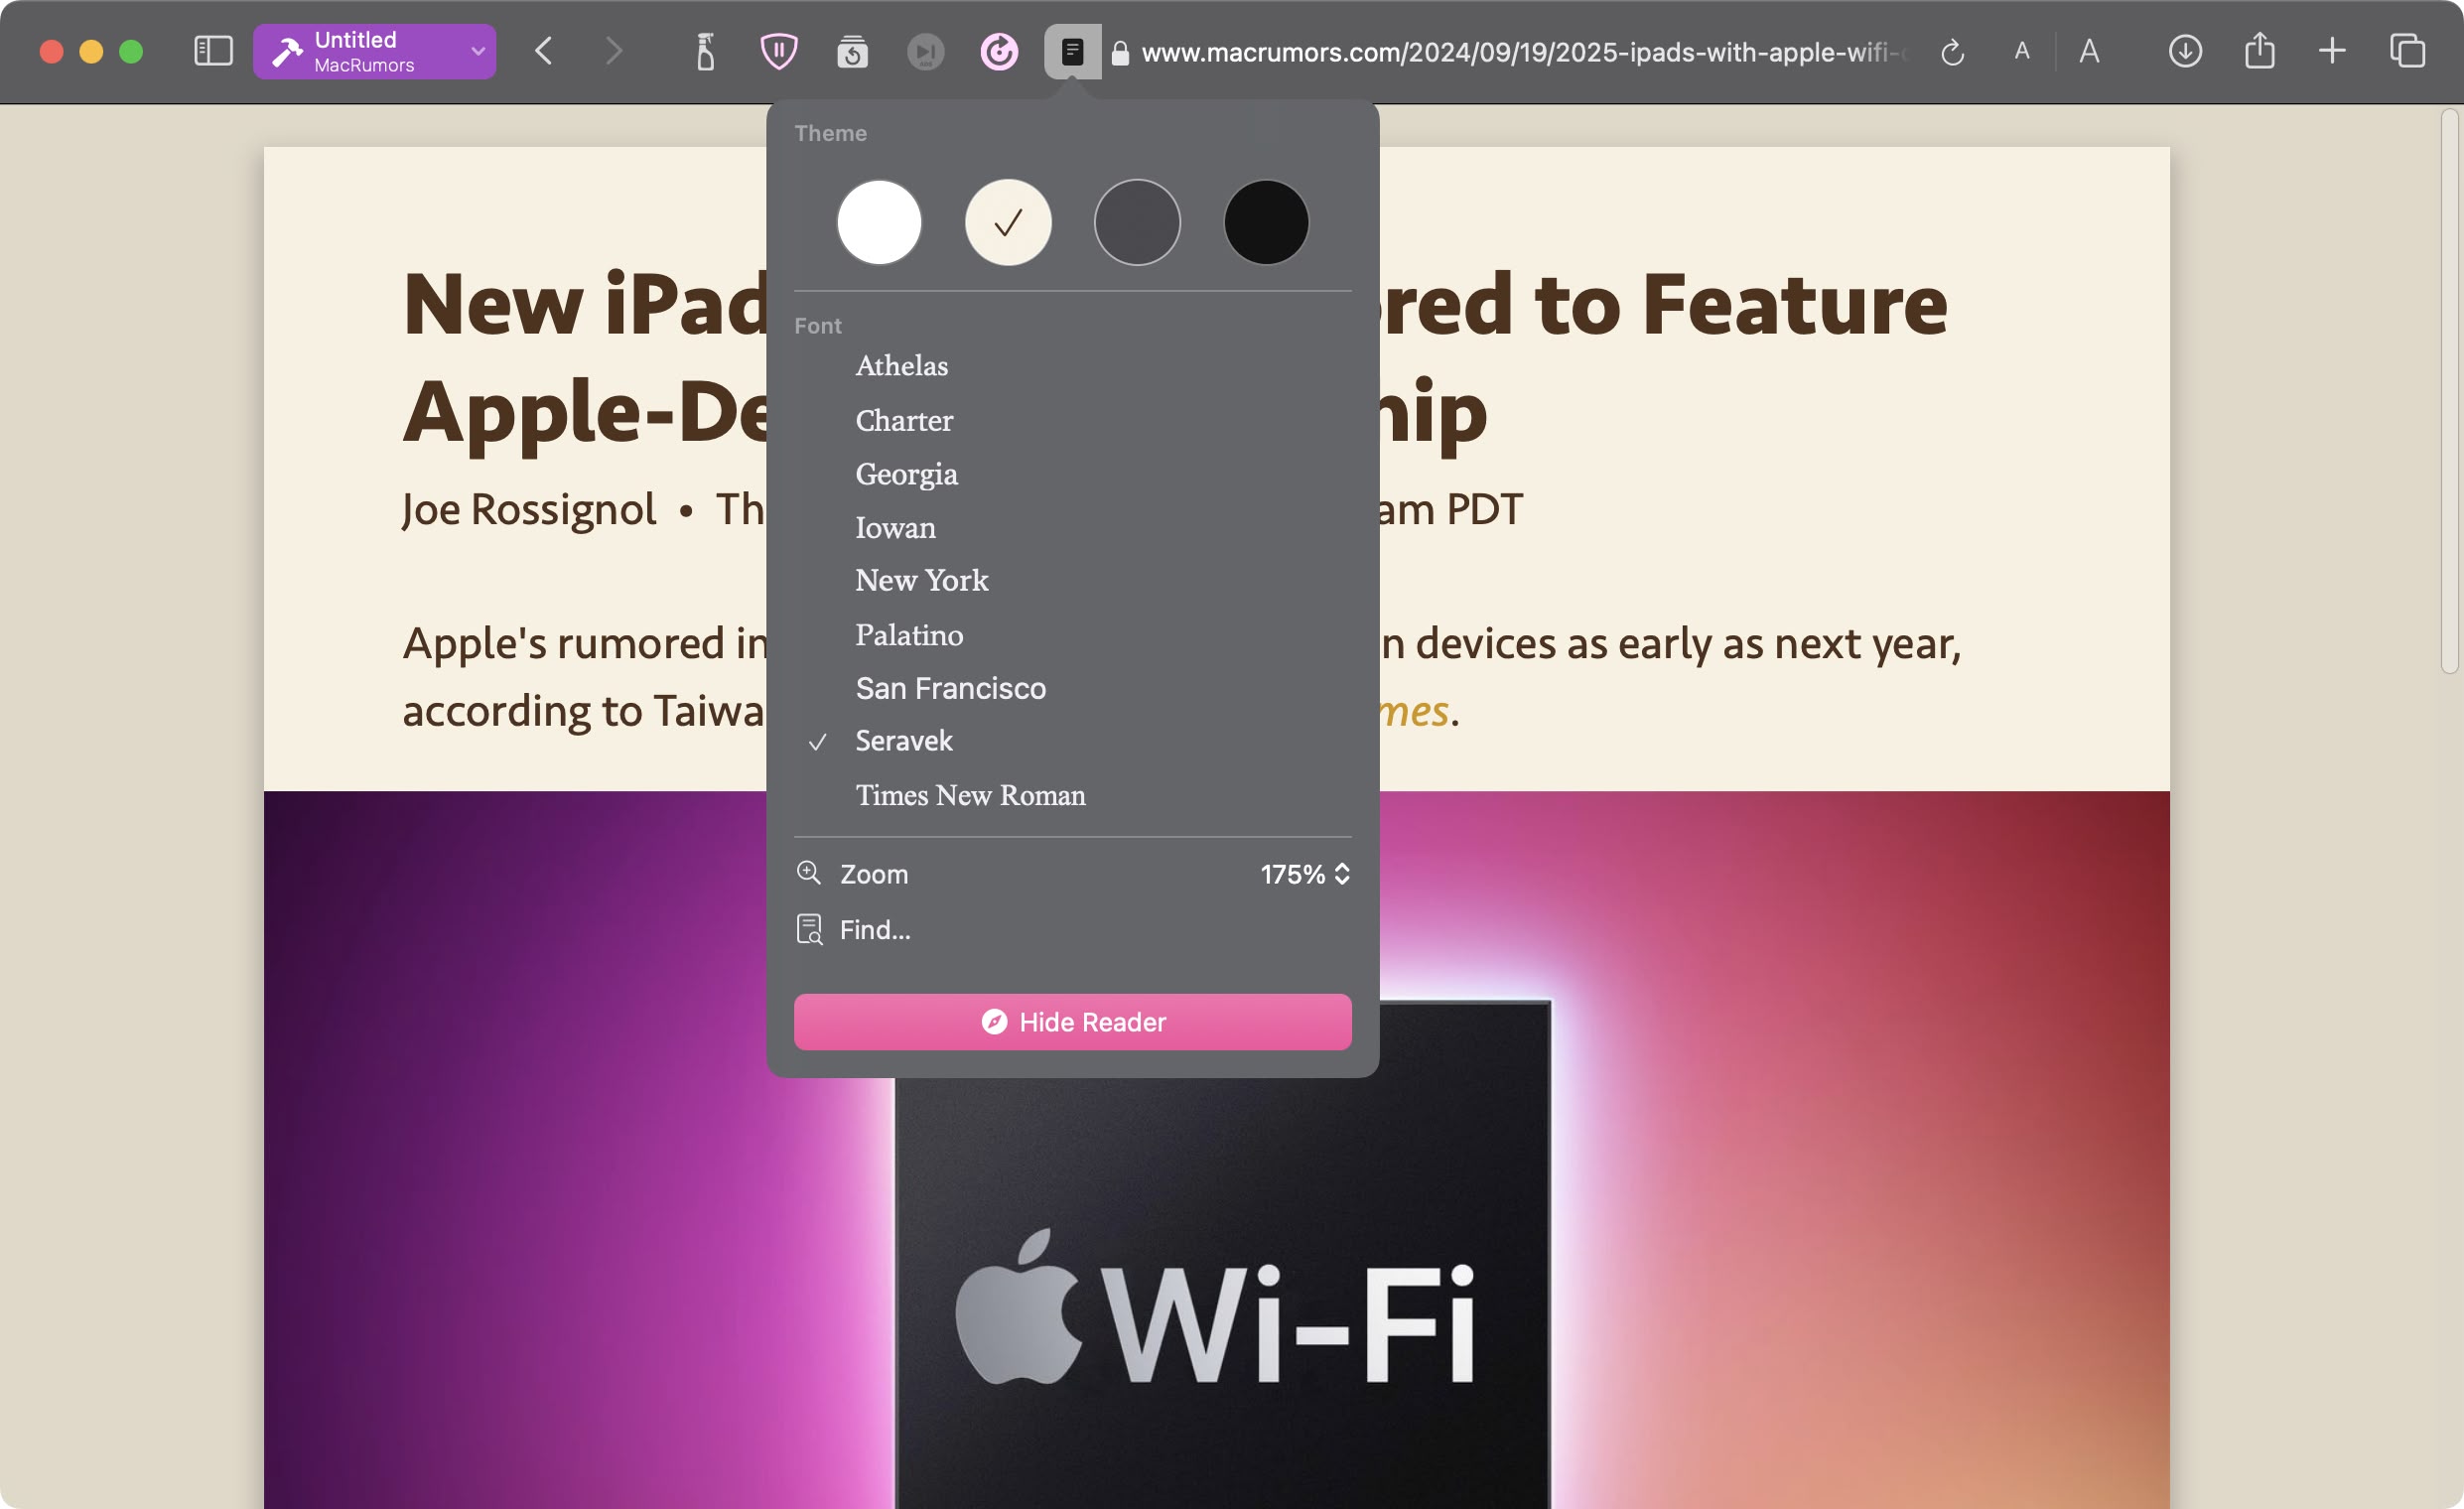
18. Change Which iPhone to Mirror
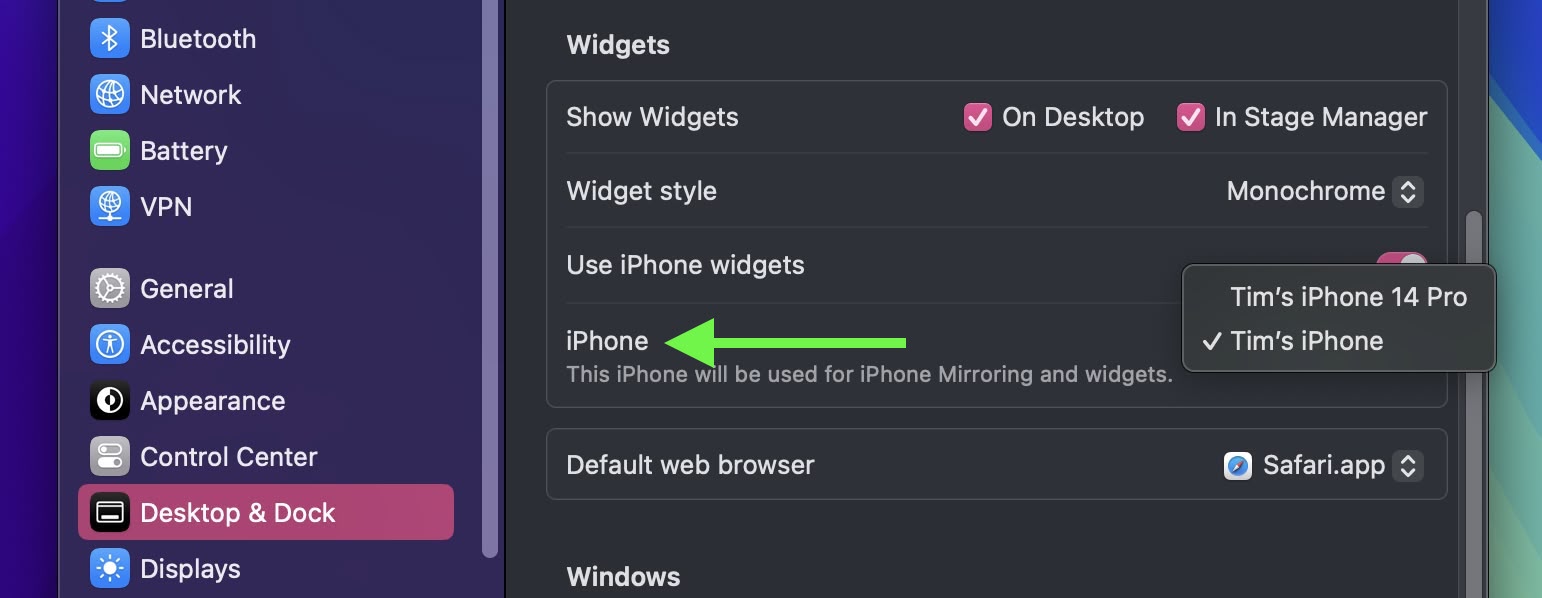
In the event that you own more than one iPhone, in System Settings ➝ Desktop & Dock, under "Widgets," there's a new iPhone option that lets you choose which iPhone to mirror on your desktop.
19. Safari Highlights
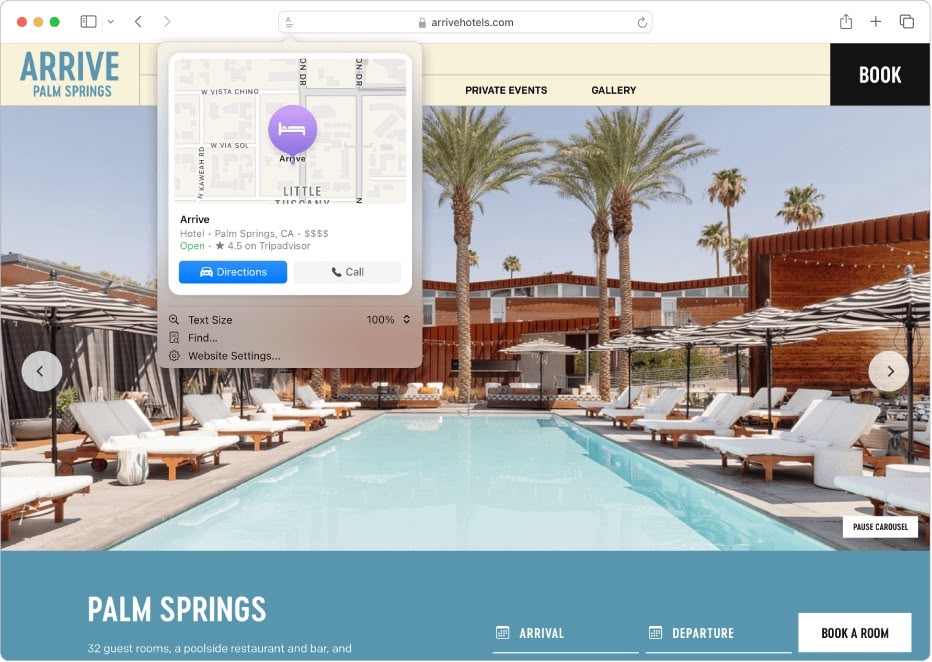
When you're browsing in Safari, look for a purple sparkle over the tool icon in the browser bar. This indicates Highlights are available. Think of Highlights as a kind of smart assistant within Safari, saving you time and effort by eliminating the need to manually search through lengthy web content.
Click the sparkle to open the Highlights window. This can display address details and operating hours for businesses, and give you quick access to directions. When browsing pages about people, it might show brief biographical information, and for entertainment content it can offer direct links to play songs or summarize reviews for movies and TV shows.
20. Remove Margins From Tiled Windows
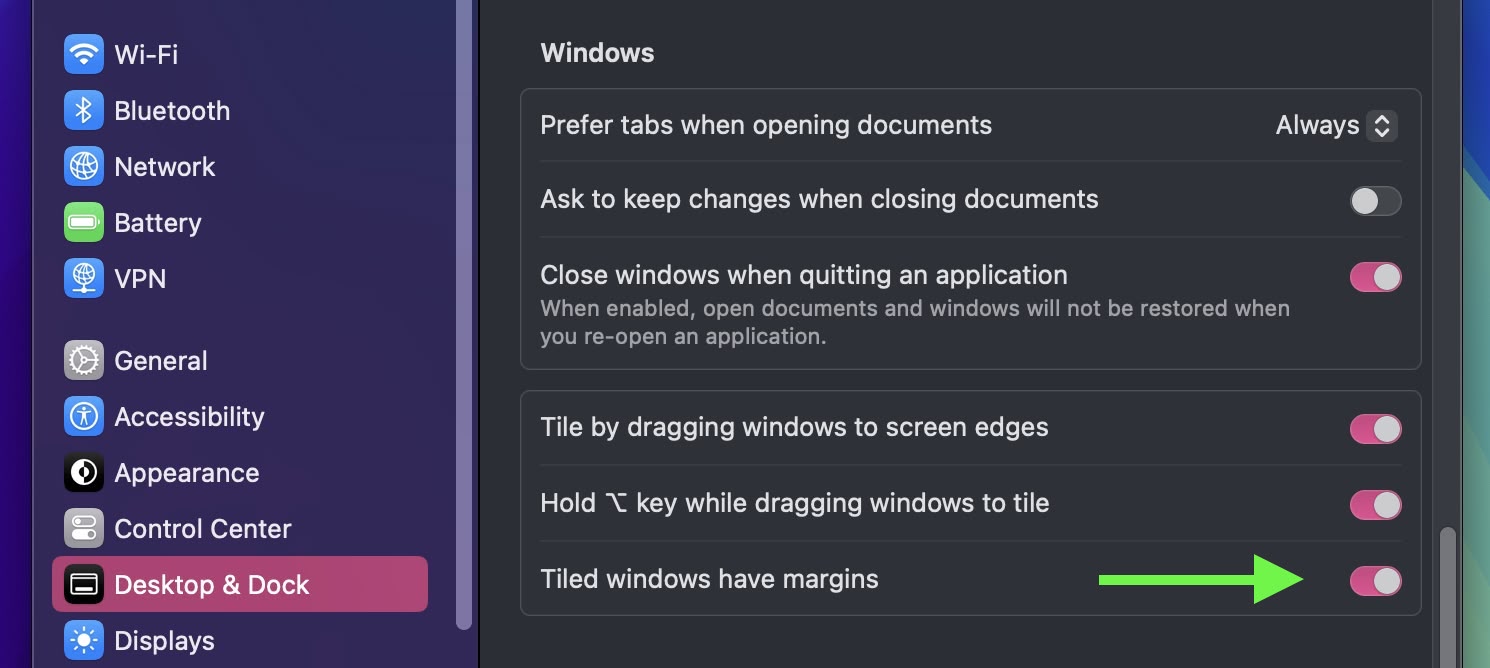
If you're not a fan of the spaces between tiled windows and don't like how the desktop seeps through the margins, there's a new option in System Settings ➝ Desktop & Dock that lets you remove them. Under the "Windows" section, look for the toggle called "Tiled windows have margins."
21. Math Notes
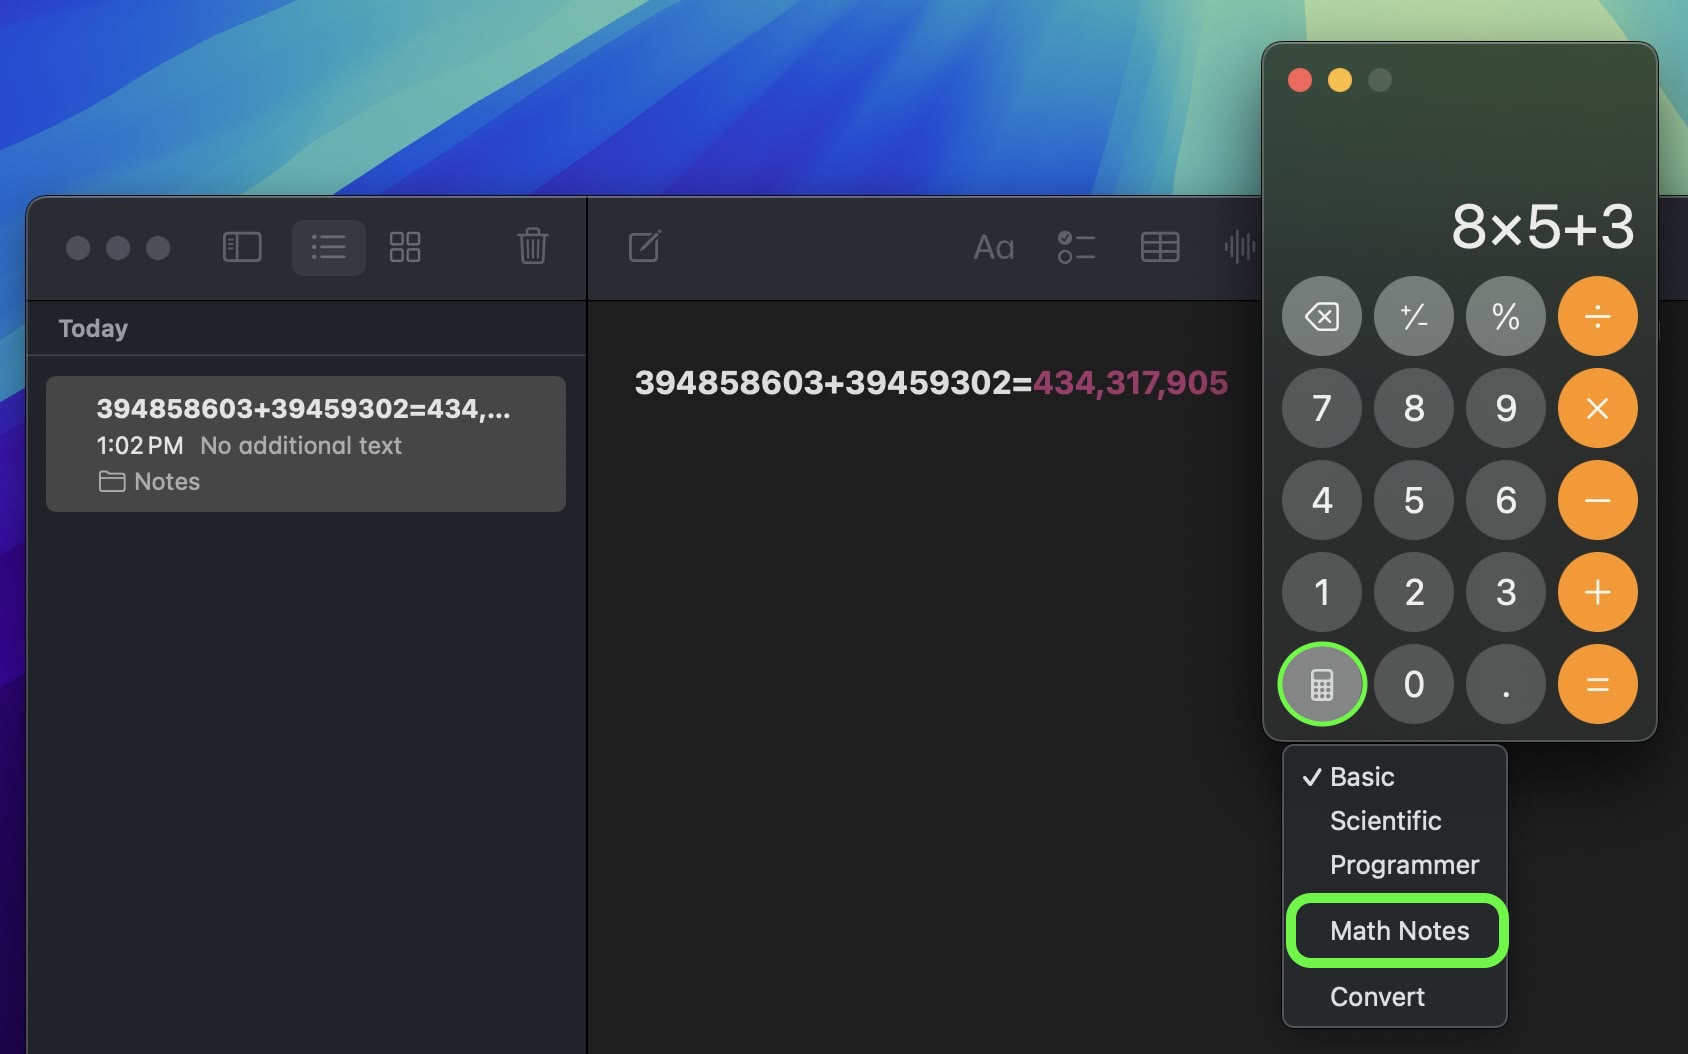
Apple has added a powerful new feature to your Mac's Calculator app: Math Notes. This integration between Calculator and Notes offers a versatile tool for all your calculation needs. It's particularly handy for splitting bills, calculating group expenses, or working through more complex mathematical problems.
Math Notes allows you to type equations directly into a note, with automatic solving when you add an equals sign. You can perform a wide range of calculations, including defining variables for more complex math. For example, if you're planning a night out, you could write "dinner = $57" and "movies = $24" in a note, then simply type "dinner + movies =" to get the total cost. To access the feature, click the calculator symbol at the bottom left of the calculator window and select Math Notes.
You're not limited to accessing Math Notes through the Calculator app – you can also use the feature directly within the Notes app using any new or existing note. In fact, you can get Math results almost anywhere in the operating system. If you type an equation into Spotlight, for example, you'll get a result, and the same goes for apps like Messages.
22. New AirDrop Interface

Sequoia includes a new UI for AirDrop that shows you a progress bar and even gives you the option to show the file in Finder once the transfer is complete, making it a lot easier to find what you've received on your Mac.
23. iPhone Mirroring Controls
When using iPhone Mirroring, if you hover your pointer just above the iPhone screen it will reveal its window and two buttons to quickly access the Home Screen and the App Switcher. There are also keyboard shortcuts to access apps, while pressing Command and the +/- keys increases and decreases the size of the mirroring window.
24. New Window Sharing Options
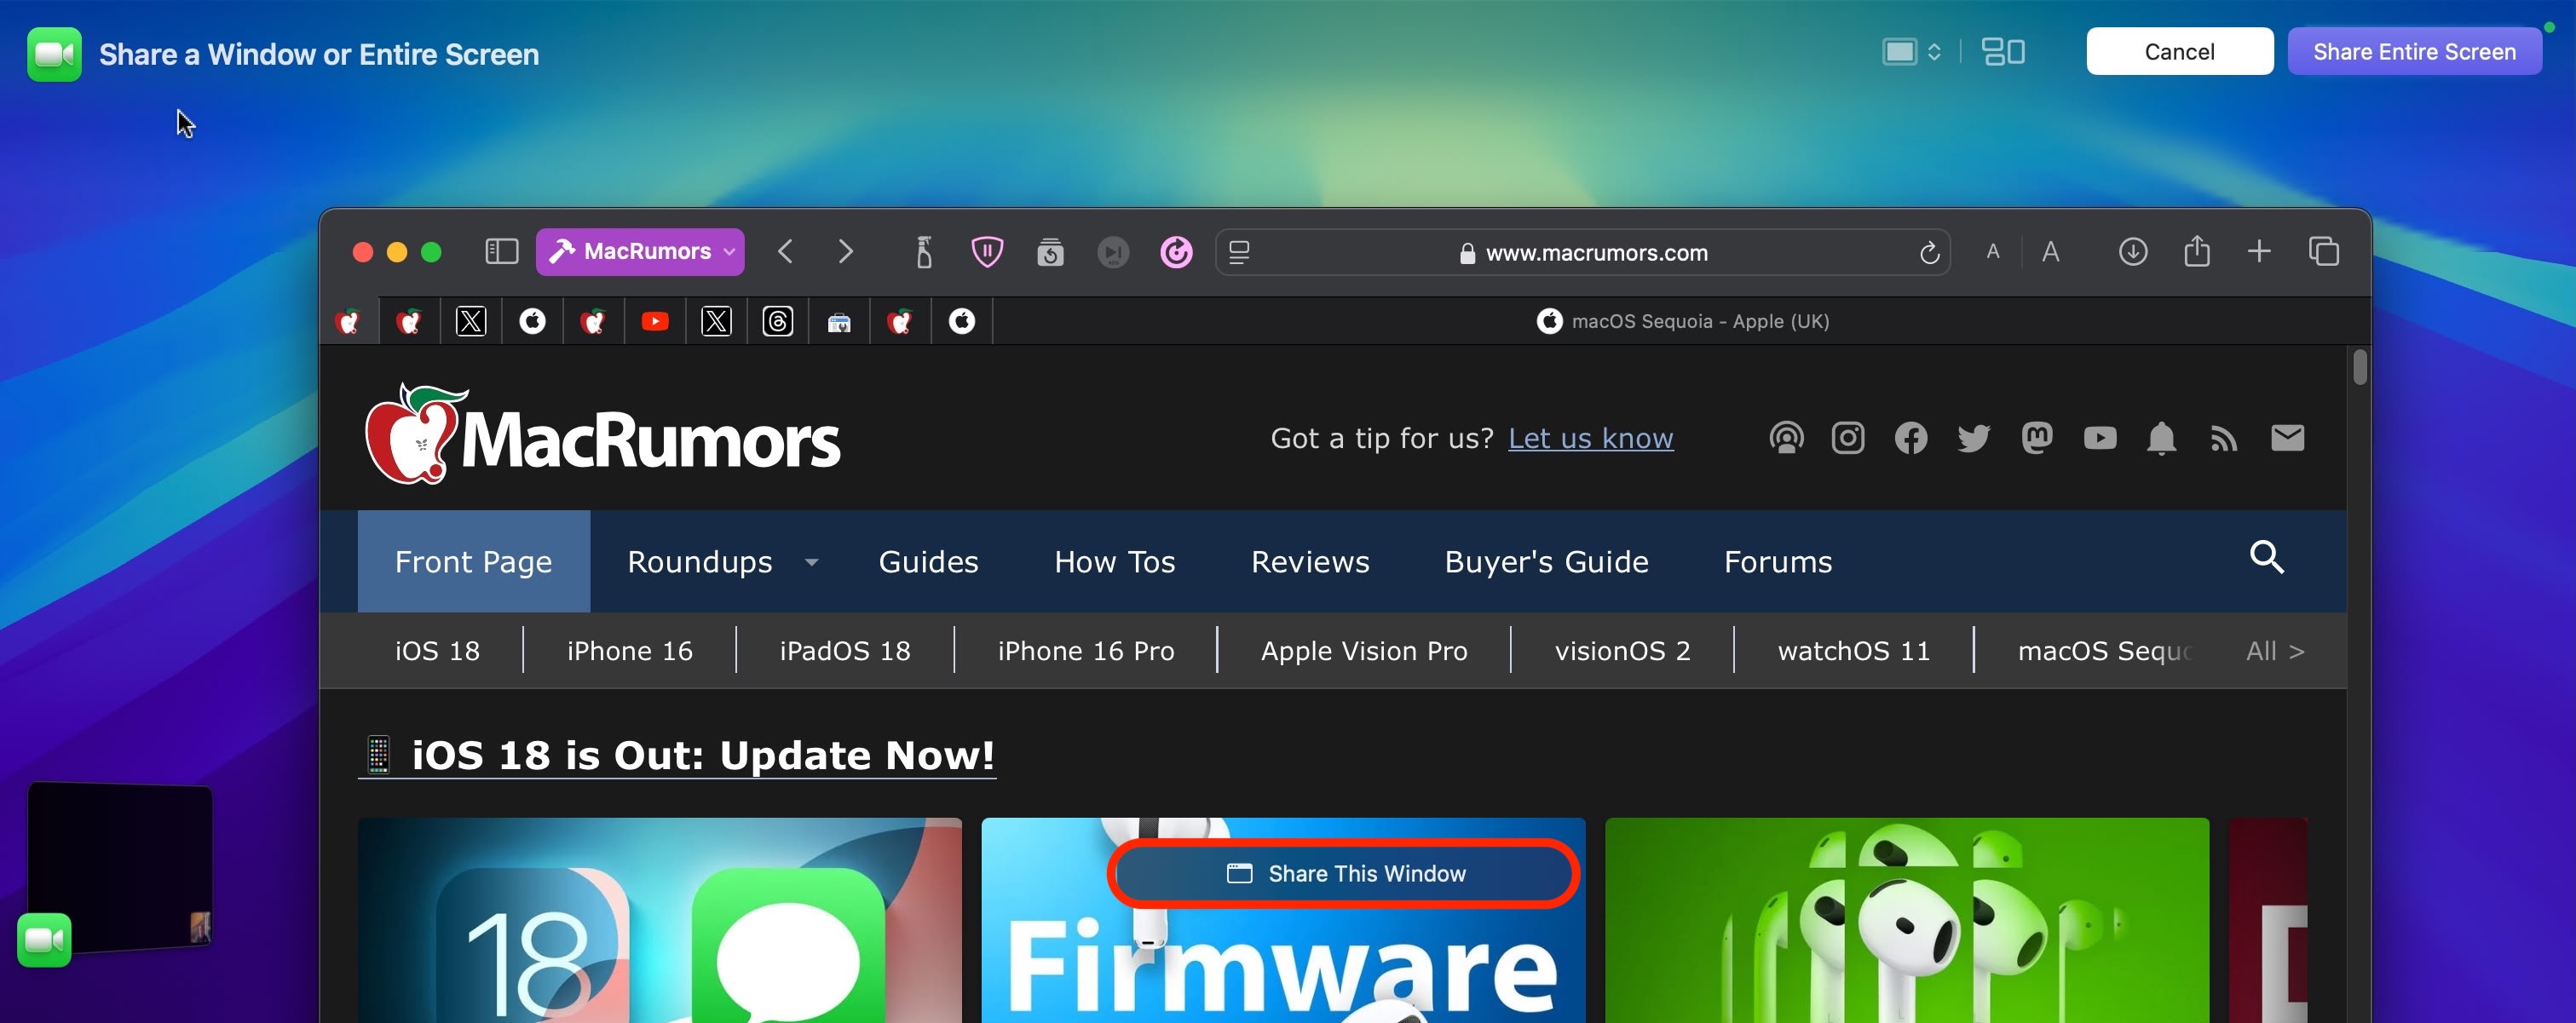
macOS Sequoia's Presenter Preview feature improves screen sharing by allowing you to share specific apps or windows instead of the entire screen. You can adjust what's being shared during a call, adding or removing windows as needed. There are also buttons to show all windows and change the presenter overlay size, giving you more control over the content being presented.
macOS uses a video controller at the top-right corner of the screen during video calls, which includes controls for webcam features when in use. This panel also now shows a preview of what's being shared, helping you stay aware of what others can see on your desktop during screen sharing sessions.
25. New FaceTime Backgrounds
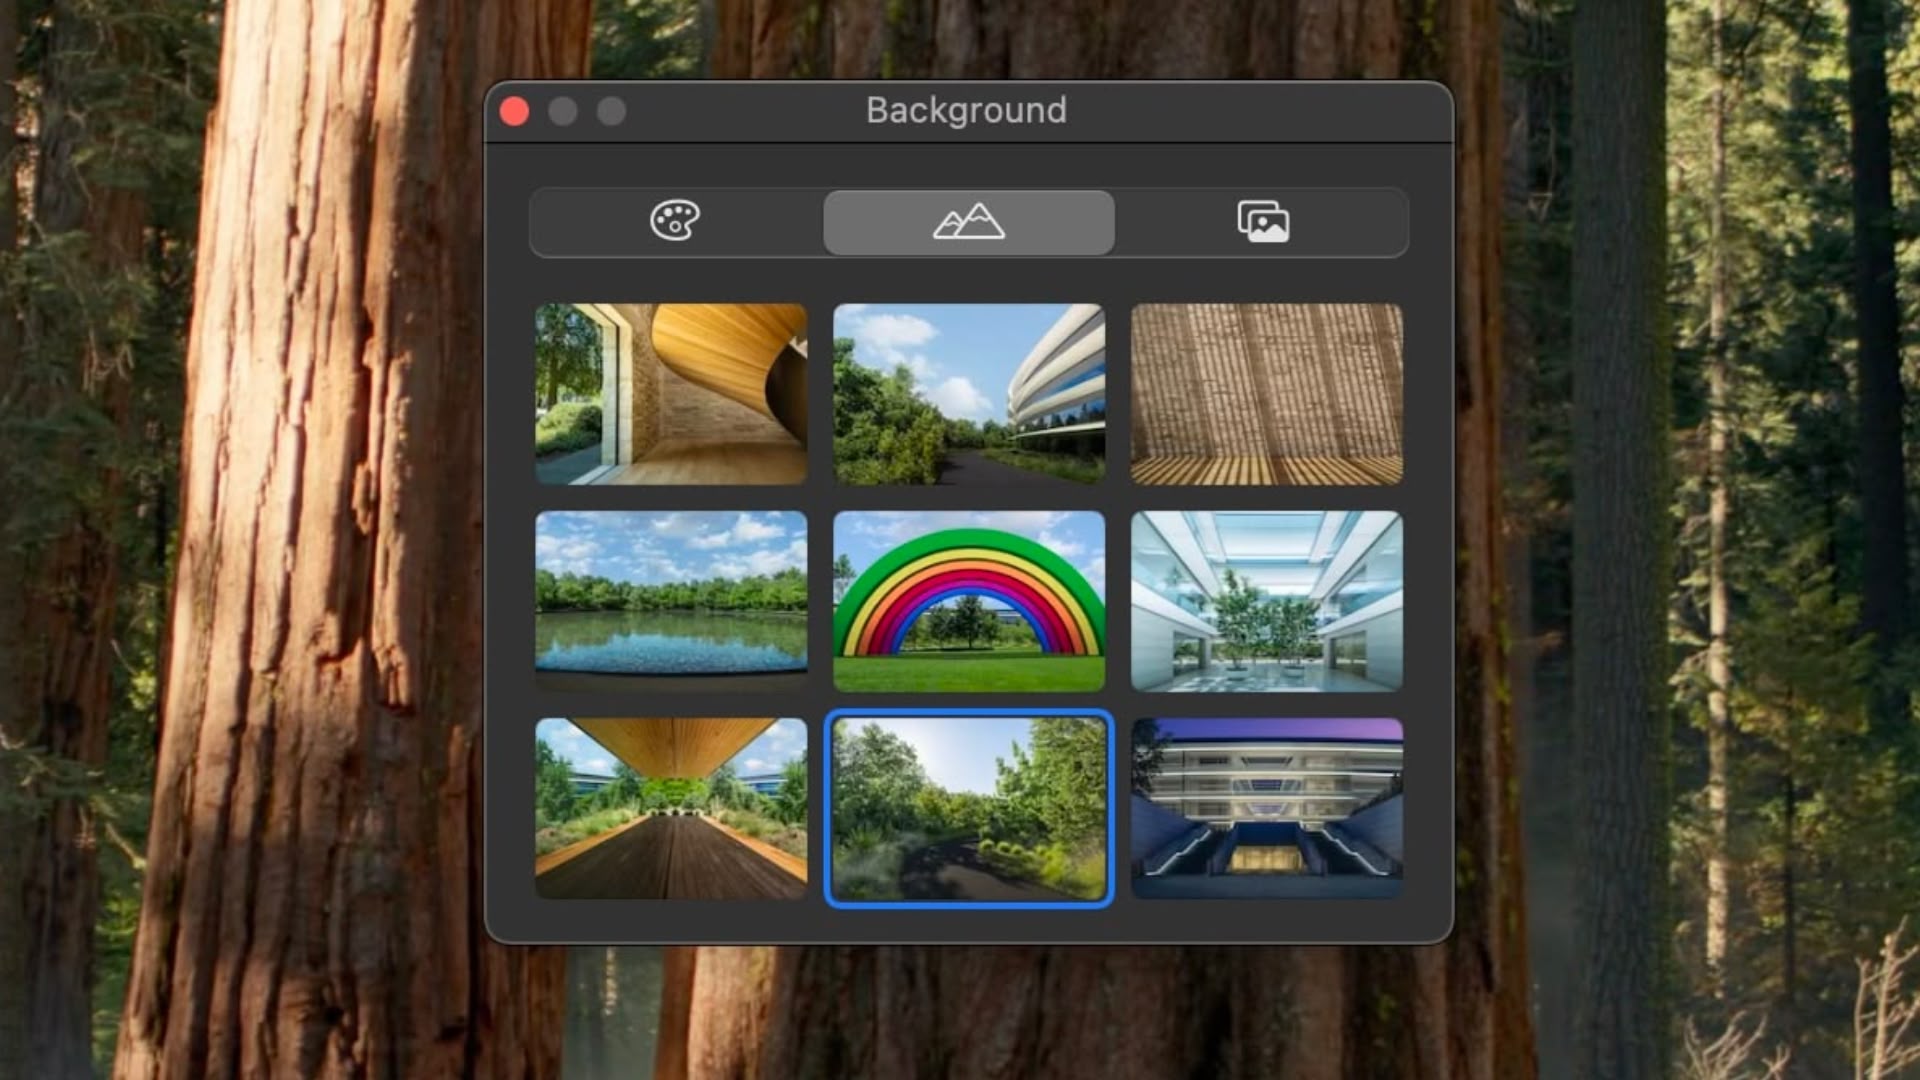
macOS Sequoia includes a set of new backgrounds for FaceTime calls, including several that showcase features of Apple Park. There are nine backgrounds in all, featuring iconic locations around the company's circular headquarters in Cupertino, California.
Other new built-in backgrounds that can be used for FaceTime and other video calls to blur out and hide what's behind you include different color gradients, along with the ability to use photos from your photo library.
26. Private Wi-Fi Address Options
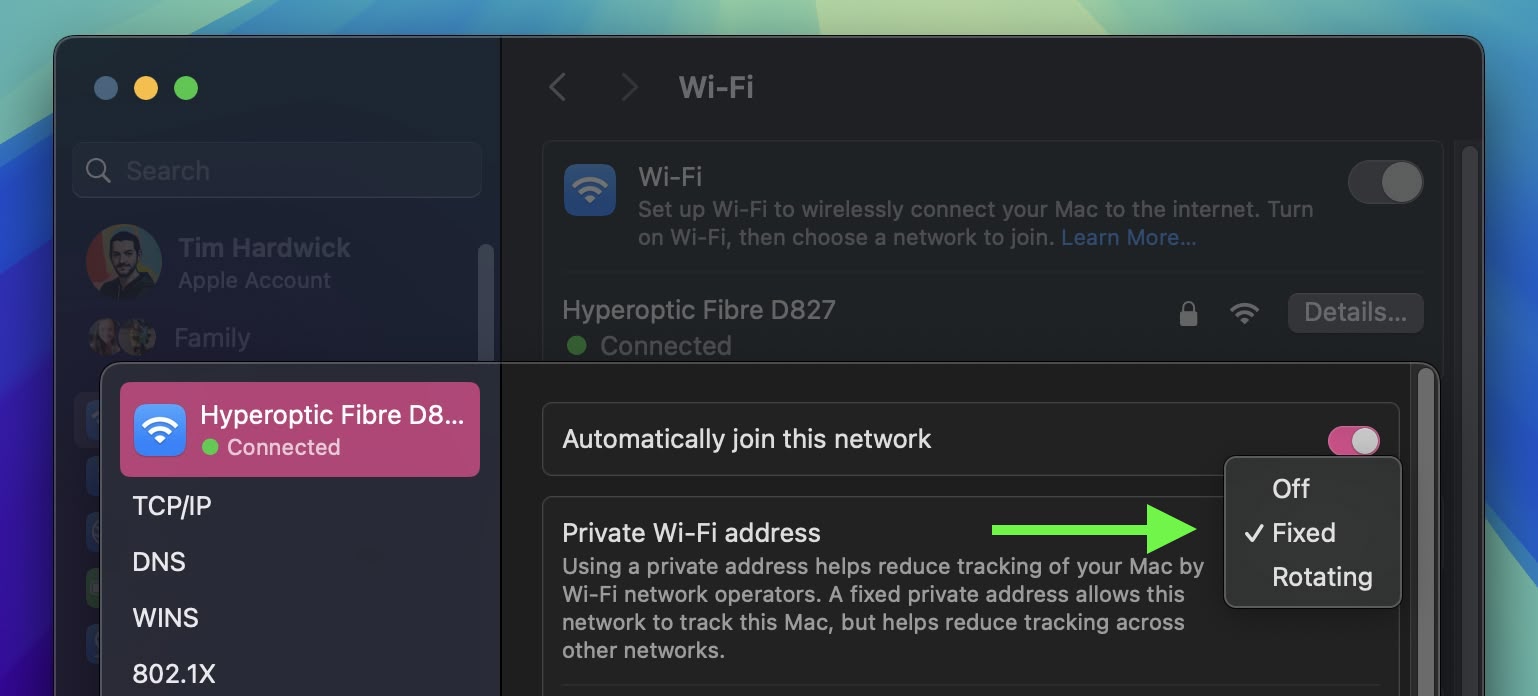
In System Settings ➝ Wi-Fi, if you click the Details button next to the currently connected network, there's a new Private Wi-Fi address option that may be familiar to users with iOS devices. A fixed private address reduces cross-network tracking by using a unique Wi-Fi address on the network. You can make it Fixed, Rotating, or turn off the option.
27. Record and Transcribe Voice Notes
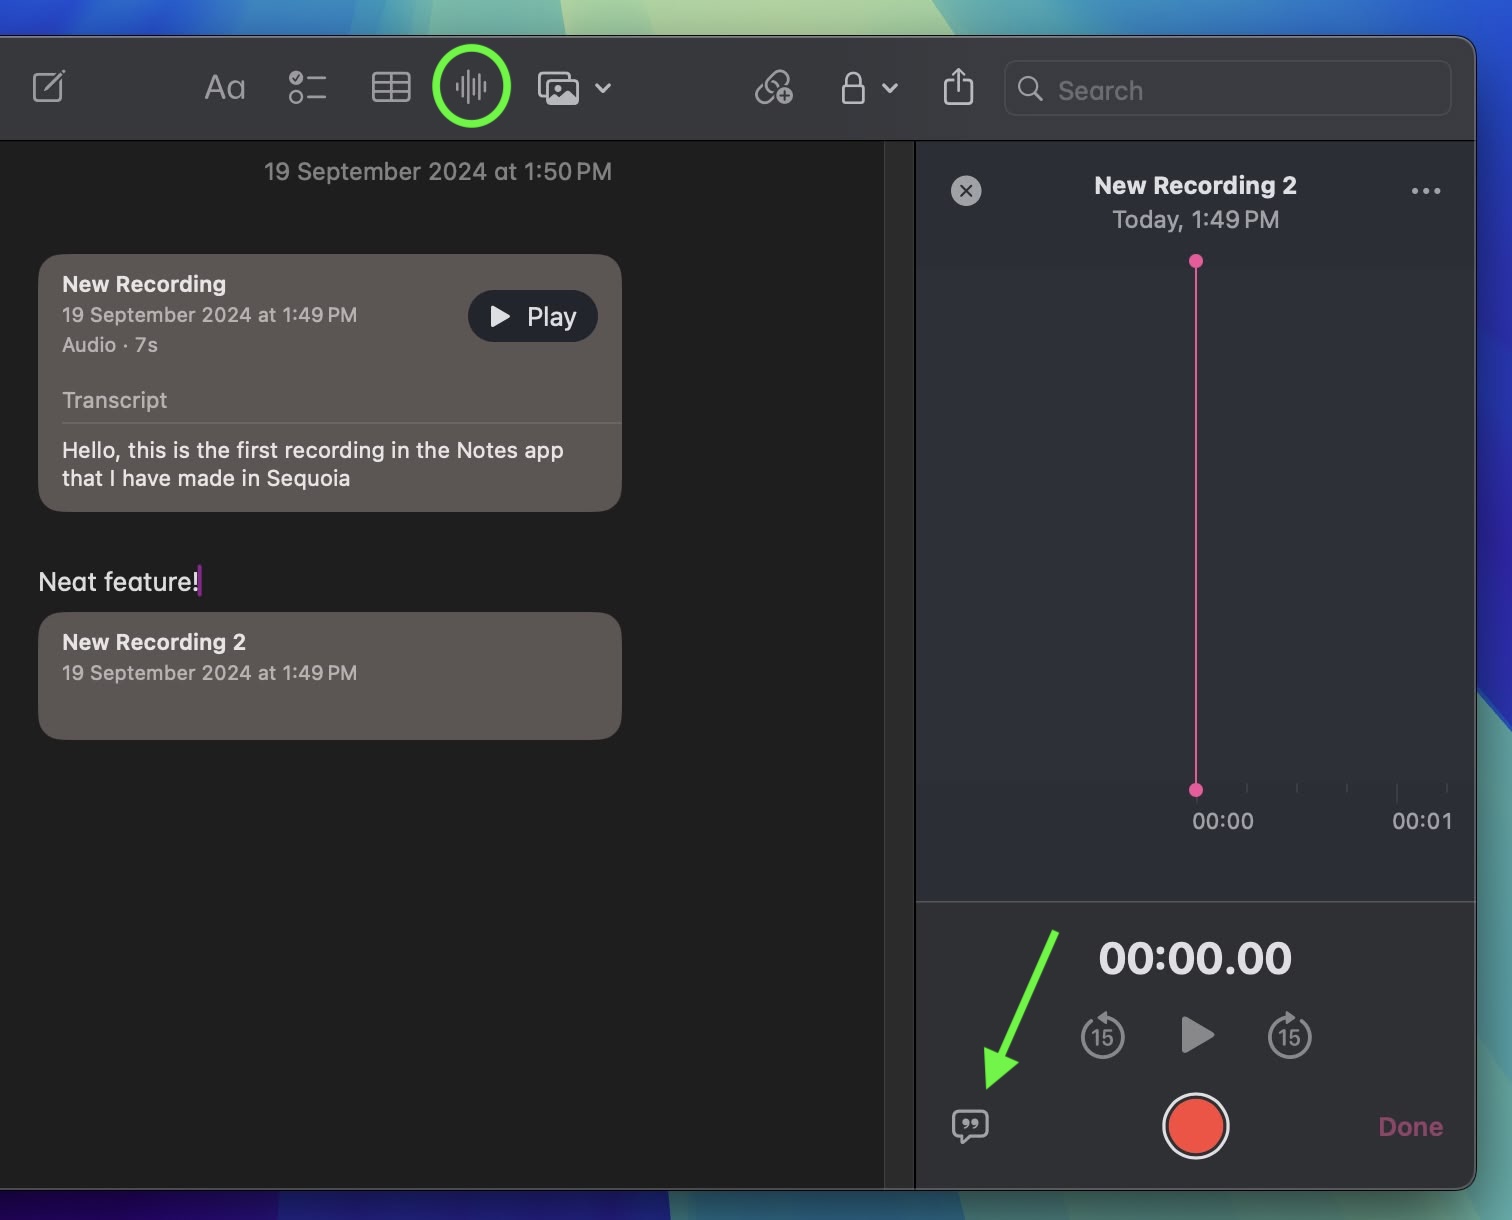
Apple has made a significant enhancement to the Notes app, introducing a built-in audio recording feature that streamlines the process of capturing and transcribing voice notes. The new audio recording tool in Notes offers more than just simple voice capture. As users record, the app automatically generates a real-time transcript, making it easier to review and search through recorded content.
To record a voice note, simply click the new waveform icon in the Notes toolbar. An interface will appear on the right showing the audio recording controls, as well as a speech bubble icon that you can use to view the transcript. When you've finished your recording, it will be saved in the note along with the accompanying transcription.
28. Web App Content Blocker Support
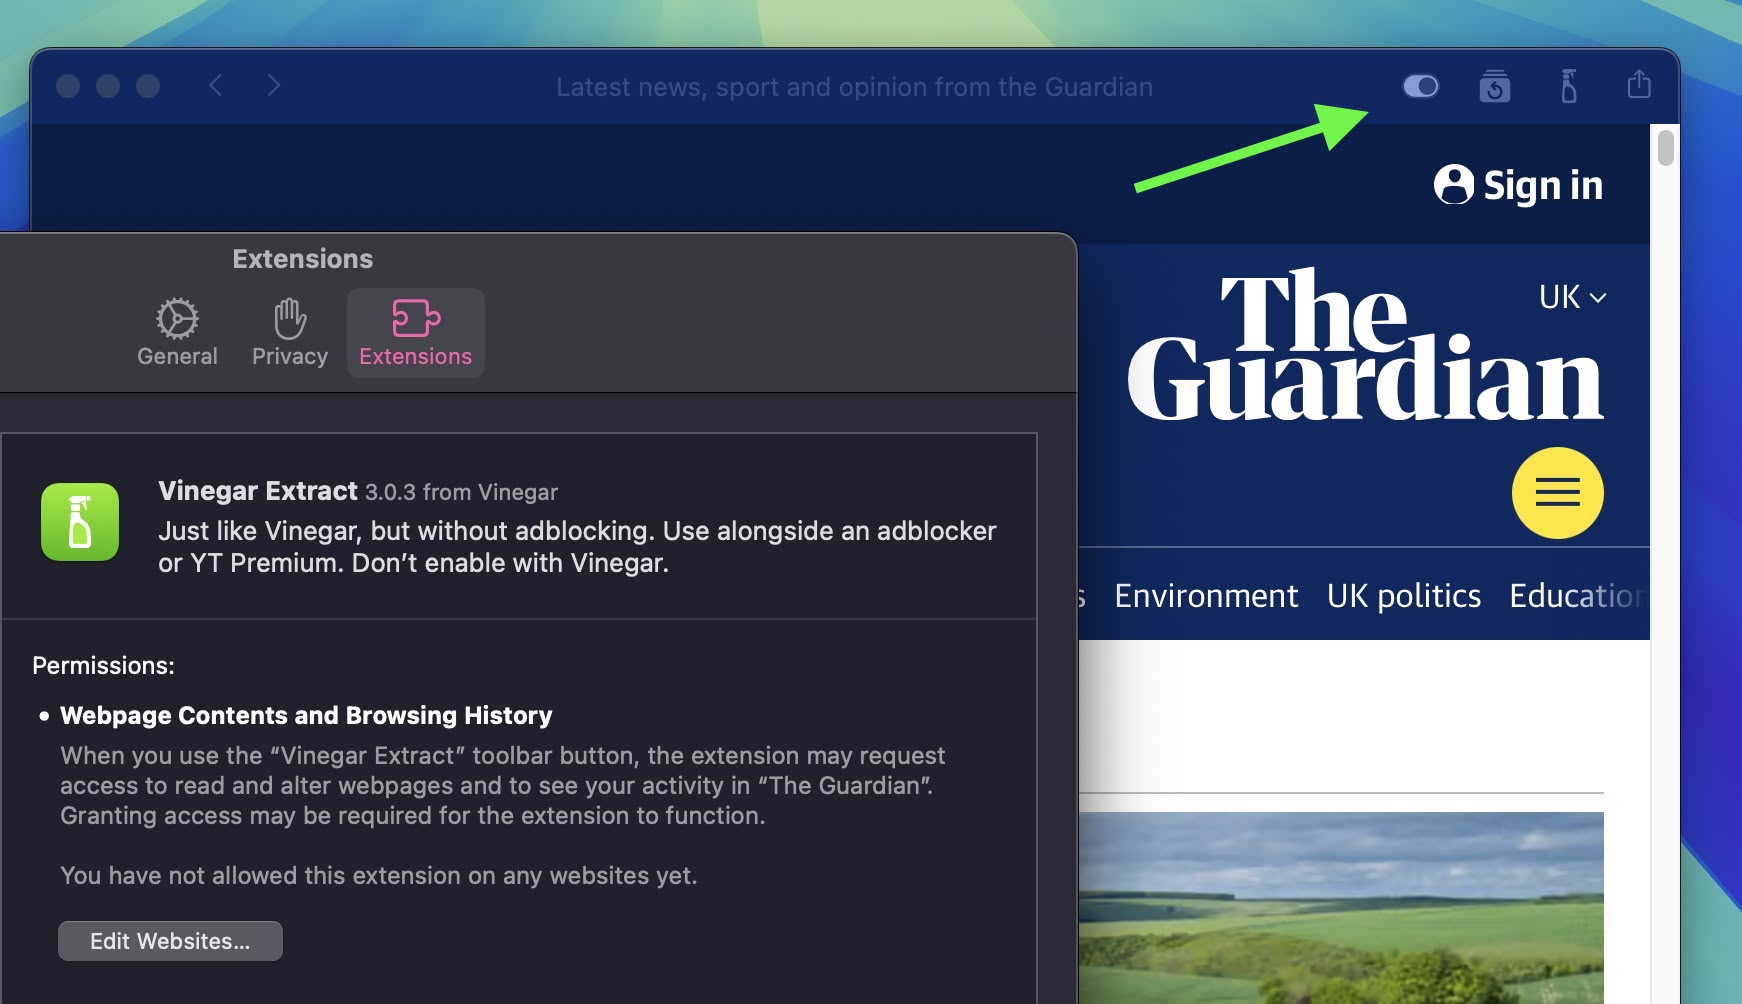
In Sequoia, web apps now support content blockers and Safari extensions, making the webpage content they present more customizable. You can control these settings by selecting Settings in the web app's menu bar, and clicking the Extensions tab.
29. Window Title Bar Double-Click Options
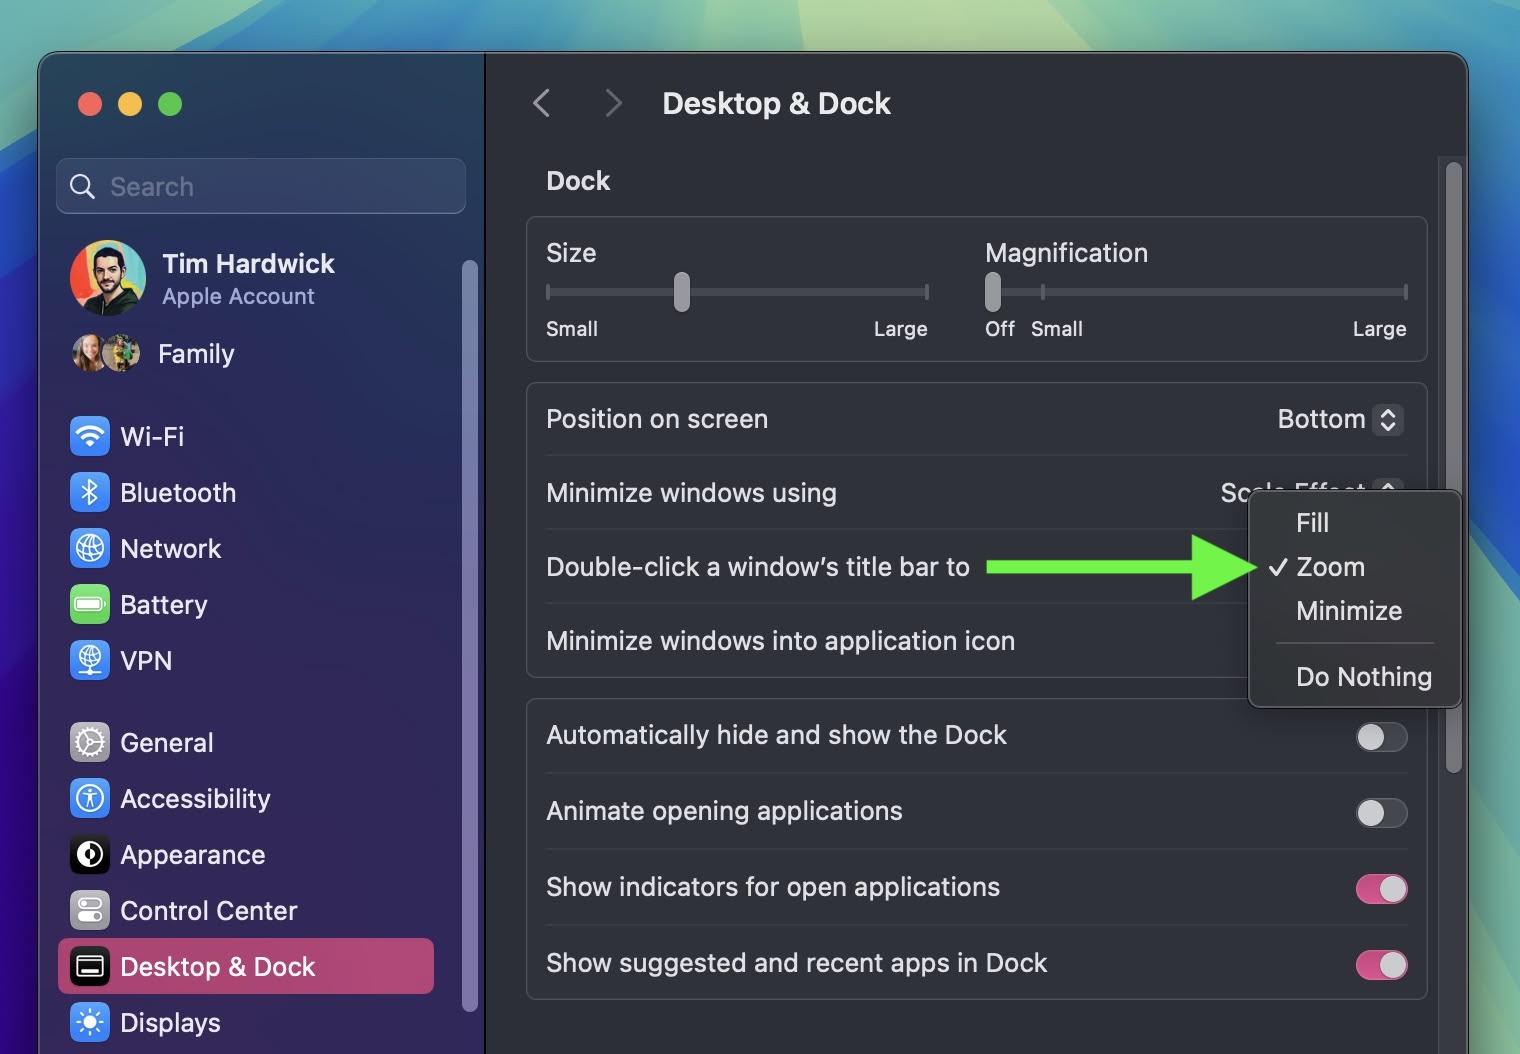
In System Settings ➝ Desktop & Dock, there's a new option to change the behavior of a window when you double-click its title bar. In Sonoma, the default behavior is to zoom the window, but in Sequoia you can change "Double-click a window's title bar to" Fill, Zoom, Minimize, or Do Nothing.
30. Hover Typing
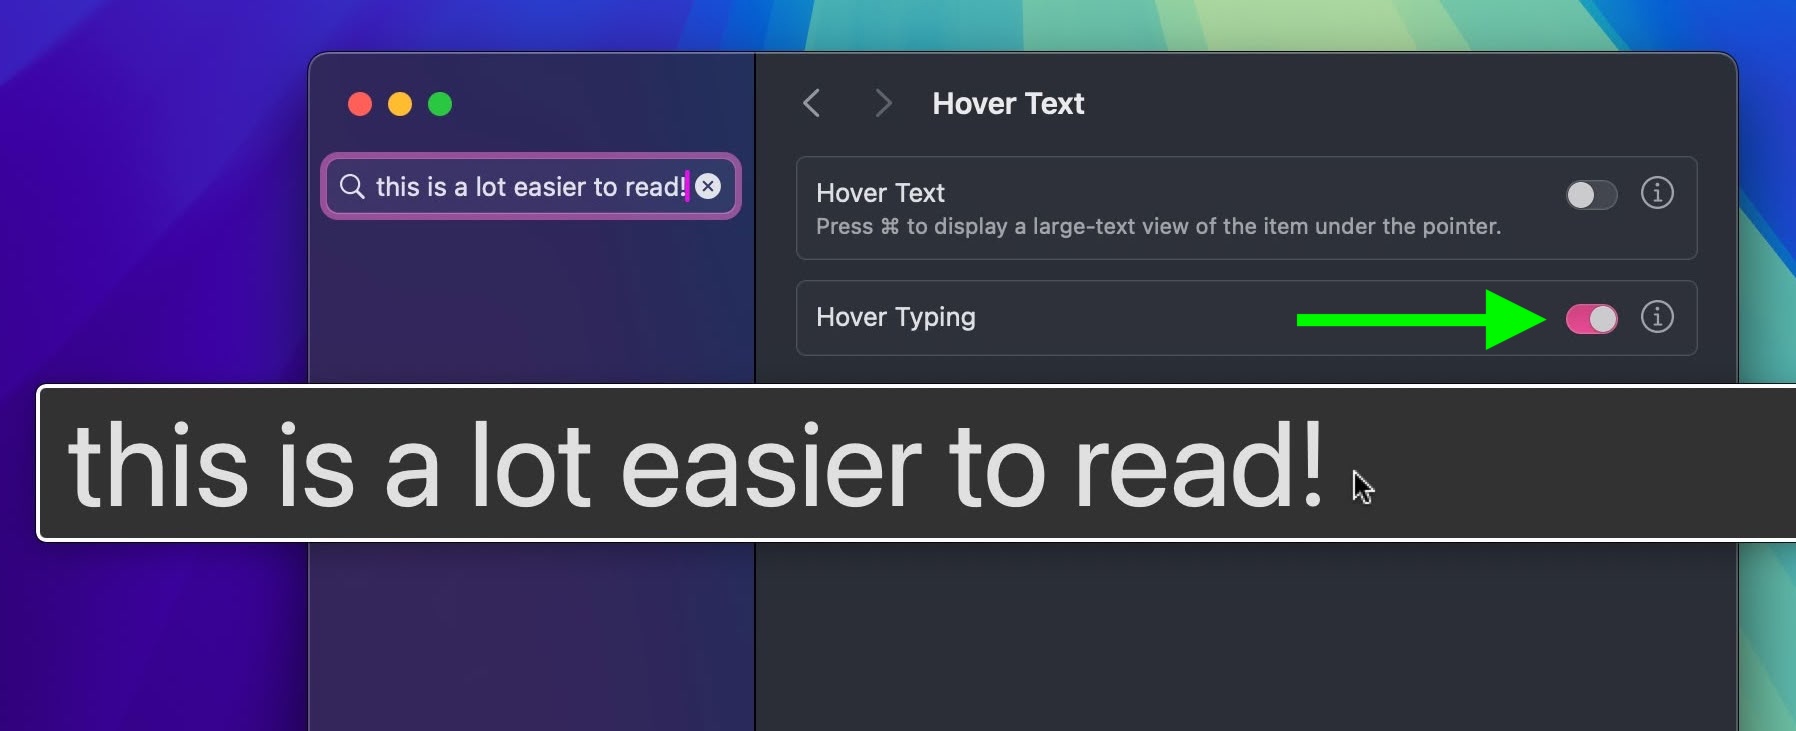
If you struggle to see what you're typing in a text field in macOS, this new feature should be very welcome. In System Settings ➝ Accessibility ➝ Hover Text, there's a new Hover Typing option that when enabled will enlarge any input field that you're typing into so that it's displayed more clearly across the center of the screen.
31. Calculator Changes
In line with iOS 18, the Calculator app for macOS has been updated, so that it now shows full expressions as you type them out. You can click on this display to undo the last thing you typed, or use the backspace button that appears when you begin pressing buttons.
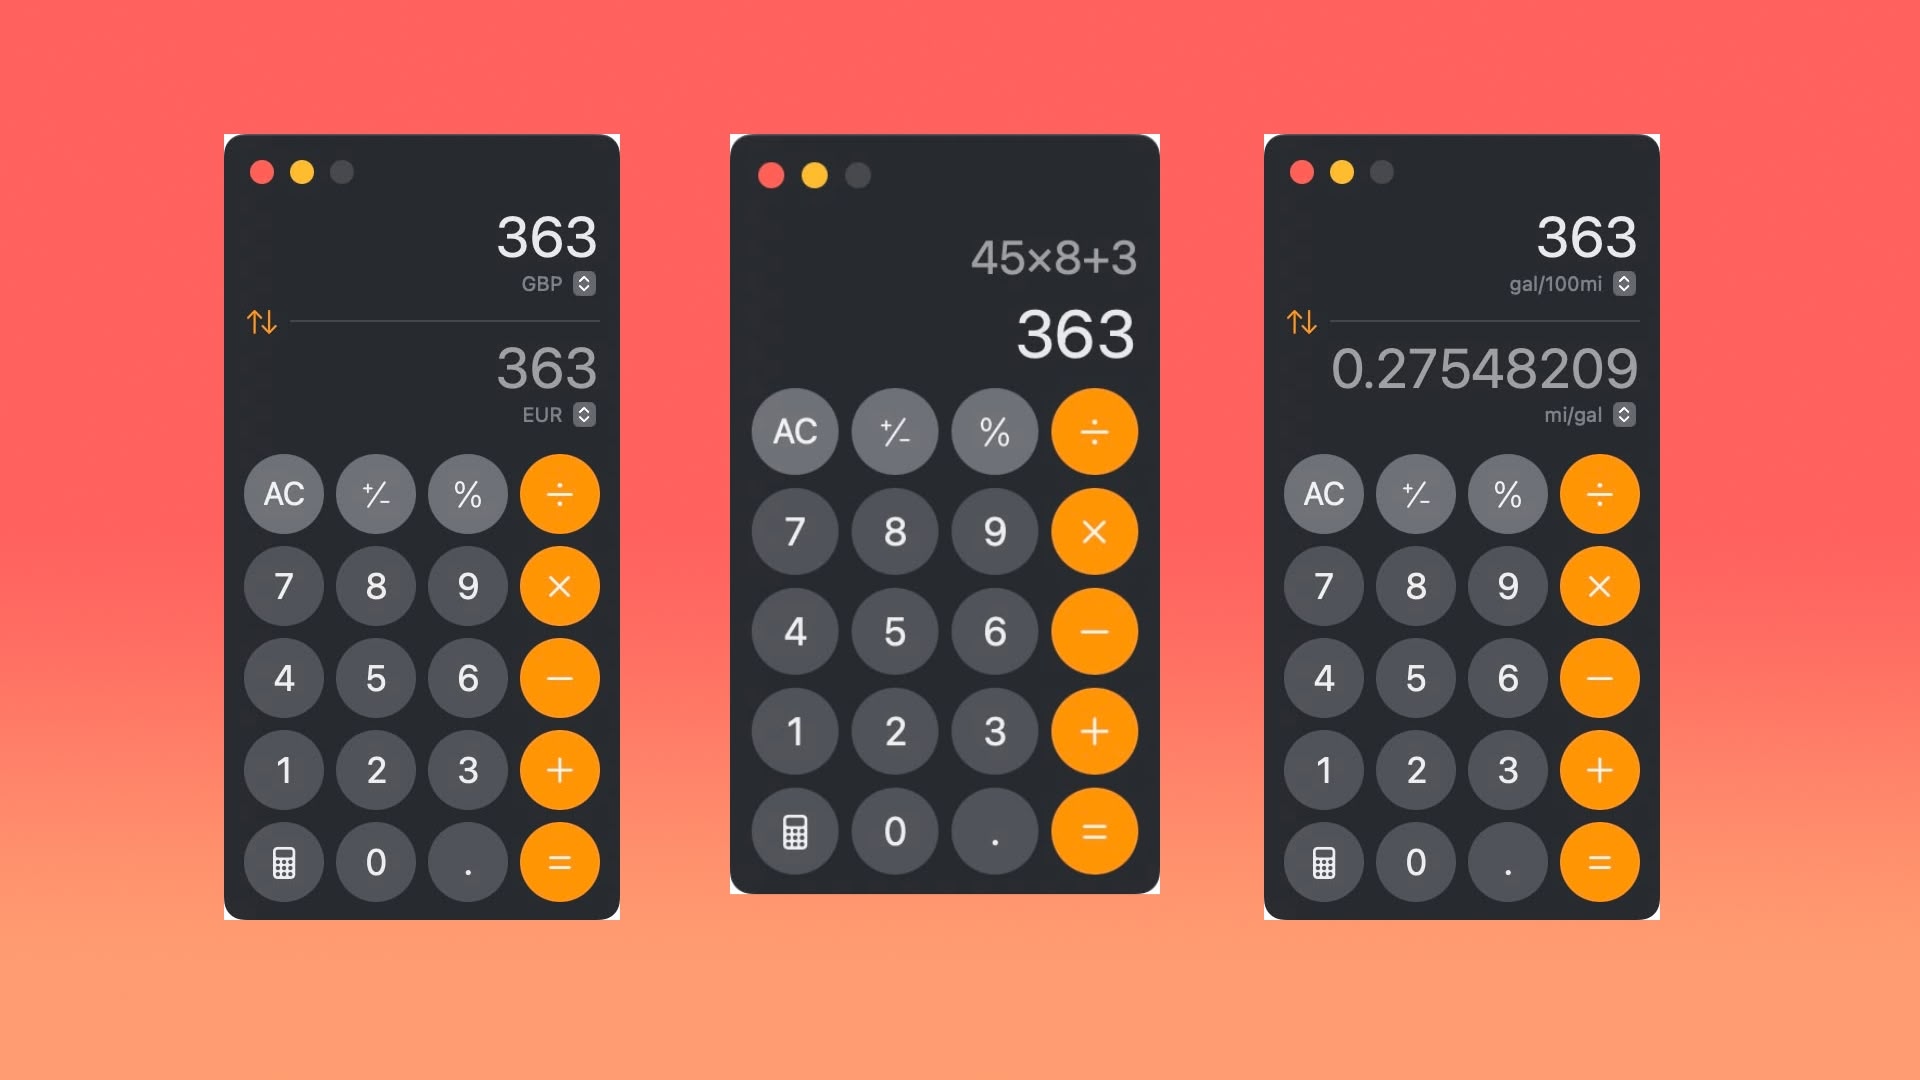
By clicking the button with the calculator icon, you can now also switch between Basic, Scientific, and Programmer calculators, open your Math Notes, or switch to a plethora of conversion options using Convert. The new Convert option supports unit conversions for length, weight, currencies, and more. Here's the full list of conversions that it supports:
- Angle
- Area
- Currency
- Data
- Energy
- Force
- Fuel
- Length
- Power
- Pressure
- Speed
- Temperature
- Time
- Volume
- Weight
32. App Store Free Space Requirements

App downloads and installations from the Mac App Store will no longer require double the amount of local storage space available. Instead, the free space requirement now matches the final install size of the app, plus a small buffer.
Apple has told developers to update any messaging related to app size requirements to reflect the change, which should reduce confusion about how much free space is needed for new app installations. The new space requirement in macOS 15 should benefit users who download large games in particular.
33. RCS Messaging
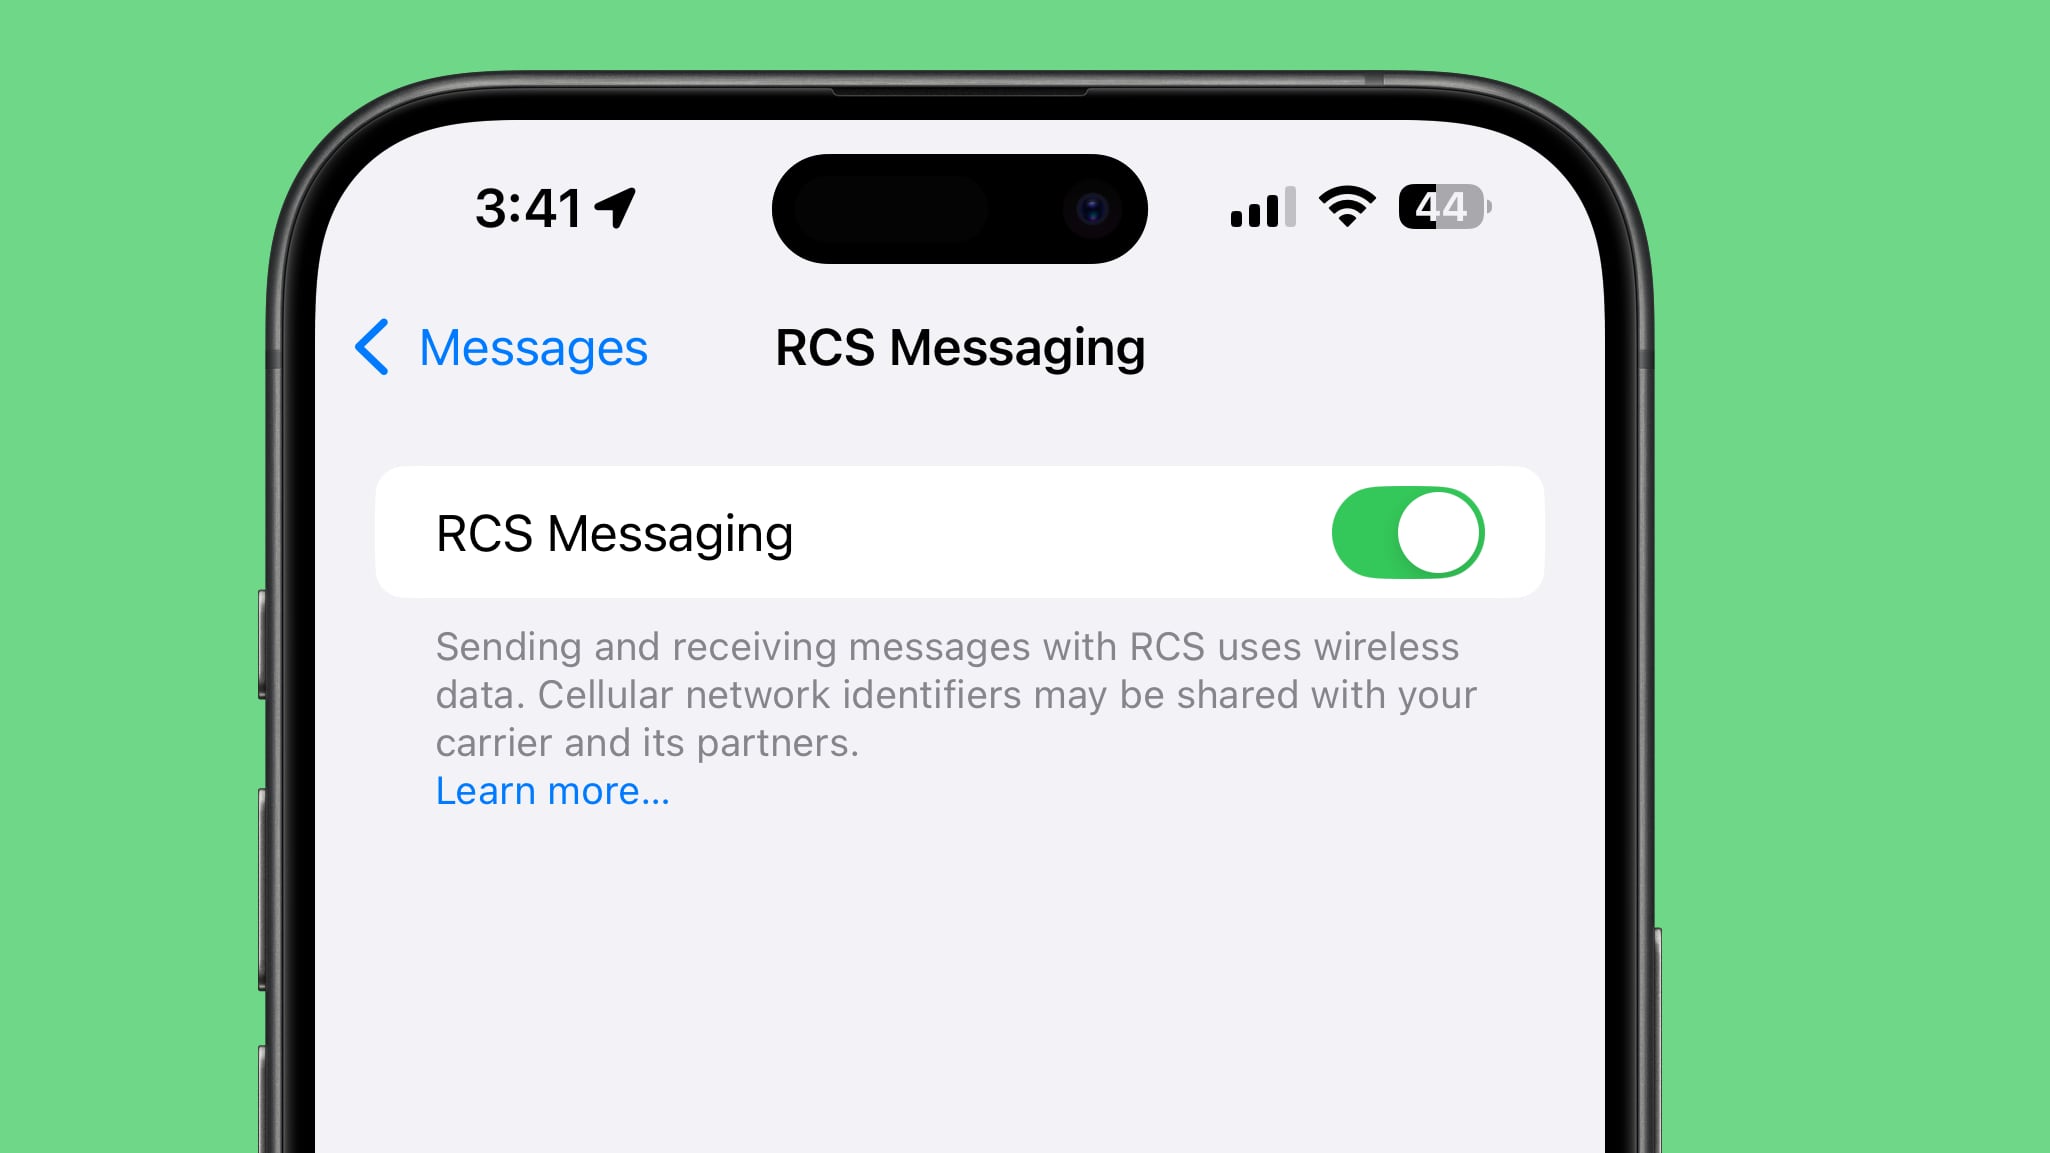
Rich Communication Services (RCS) is a messaging standard Apple has adopted in macOS Sequoia and iOS 18 to bridge the gap between green and blue bubbles. With RCS Messaging (Settings ➝ Messages ➝ RCS Messaging) and Text Message Forwarding enabled on your iPhone (Settings ➝ Messages ➝ Text Message Forwarding) for your Mac, you can enjoy all the capabilities RCS brings cross-platform conversations right on your desktop.
With RCS support, you can send texts, high resolution photos and videos, links, and more through the Messages app, just as if they were iMessages. RCS also supports delivery and read receipts and typing indicators. Note that RCS support must be enabled by each carrier. You can check if your network supports it by visiting Apple's
Wireless carrier support webpage.
34. New iCloud Settings Panel
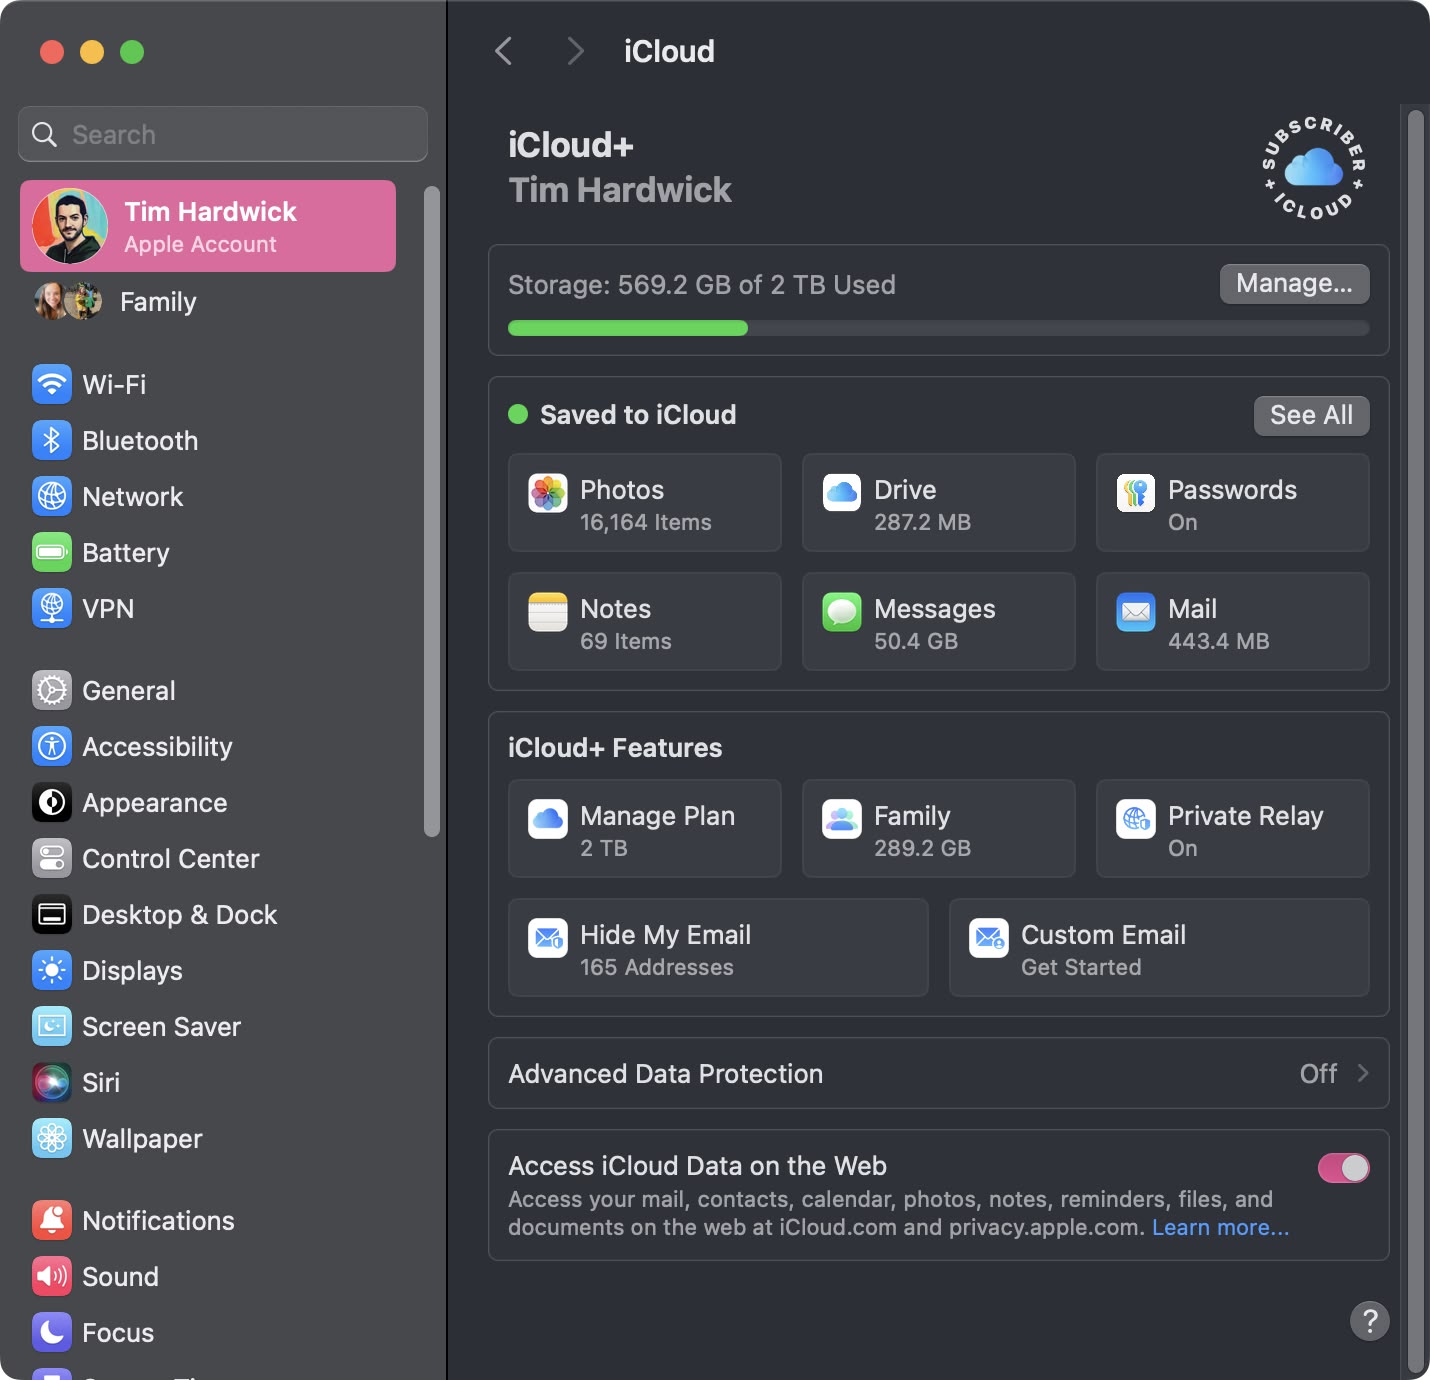
Just like on iPhone with iOS 18, the iCloud section in System Settings ➝ Apple Account has been completely redesigned for macOS Sequoia. The panel is divided into neater sections showing your storage, files saved to iCloud, and any iCloud+ features you may have, making everything just a little bit easier to comprehend. You can also manage how individual apps and features on your Mac sync with iCloud by clicking the See All button.
35. Vocal Shortcuts
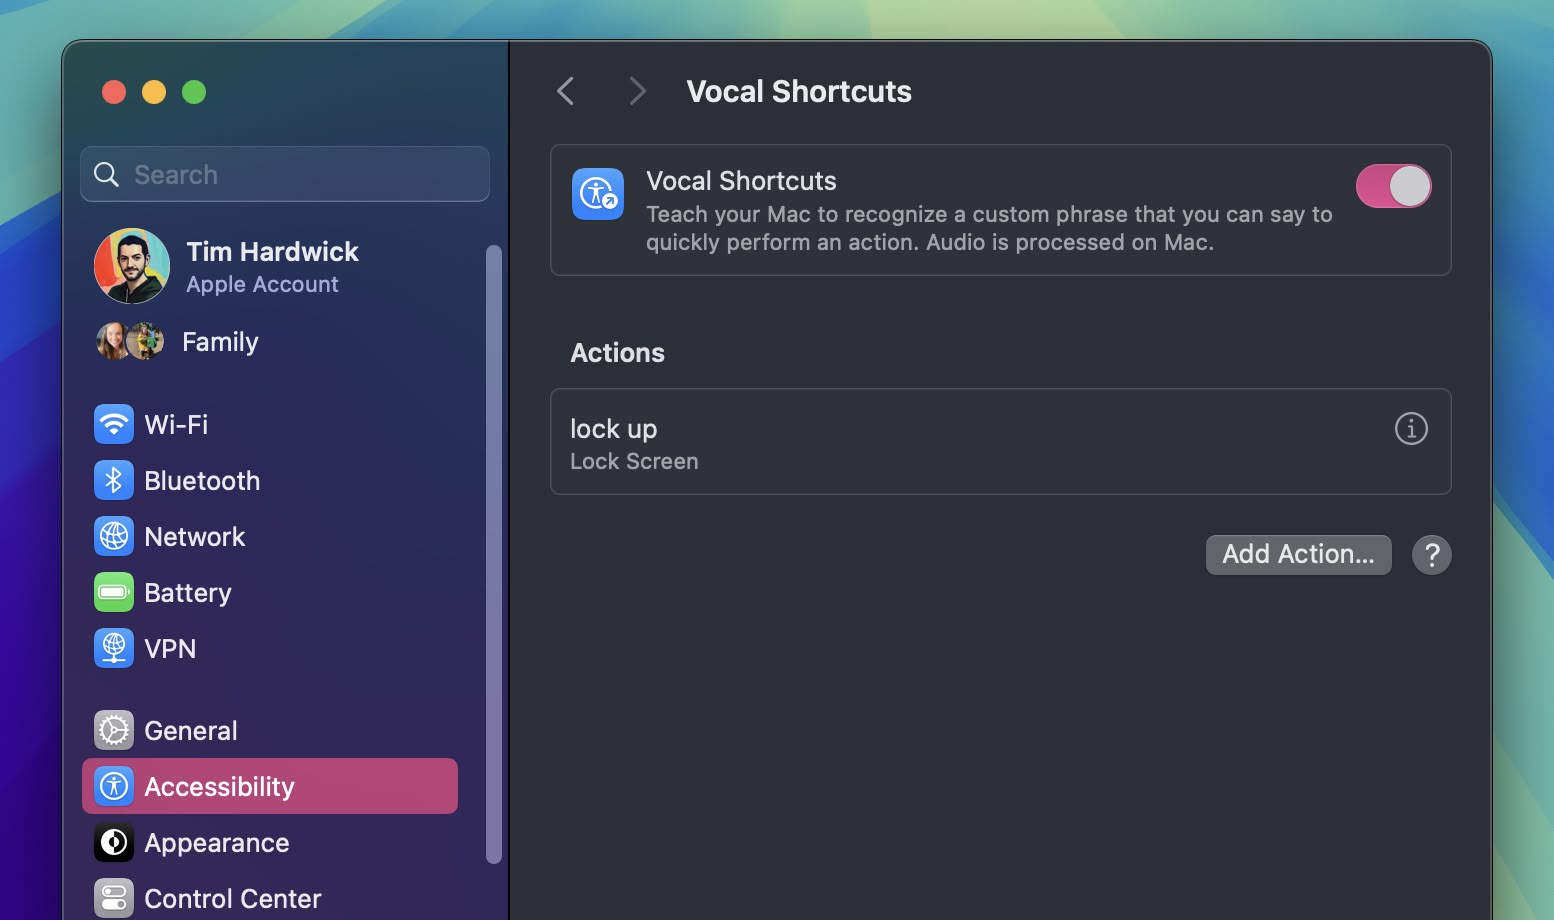
In System Settings ➝ Accessibility, there's an option to set up the new Vocal Shortcuts feature, which allows you to teach your Mac to recognize a custom phrase that you can say to quickly perform an action. These phrases can be used for anything from triggering Siri requests to shortcuts on your Mac.
36. Use Emoji as Messages Tapback Reactions

Apple has introduced significant updates to its Messages app in macOS Sequoia, with a particular focus on enhancing the popular Tapback feature. Tapbacks, the quick reactions users can add to messages by long-pressing on them, have received a colorful makeover and expanded functionality.

The six standard Tapback icons now feature more vibrant colors and intricate details. But perhaps the most notable change is the addition of emoji support for Tapbacks. While the classic six reactions remain, you now have the option to choose from a wide array of emoji characters, adding a new layer of personalization to your message responses.
37. Sign In With Apple Settings
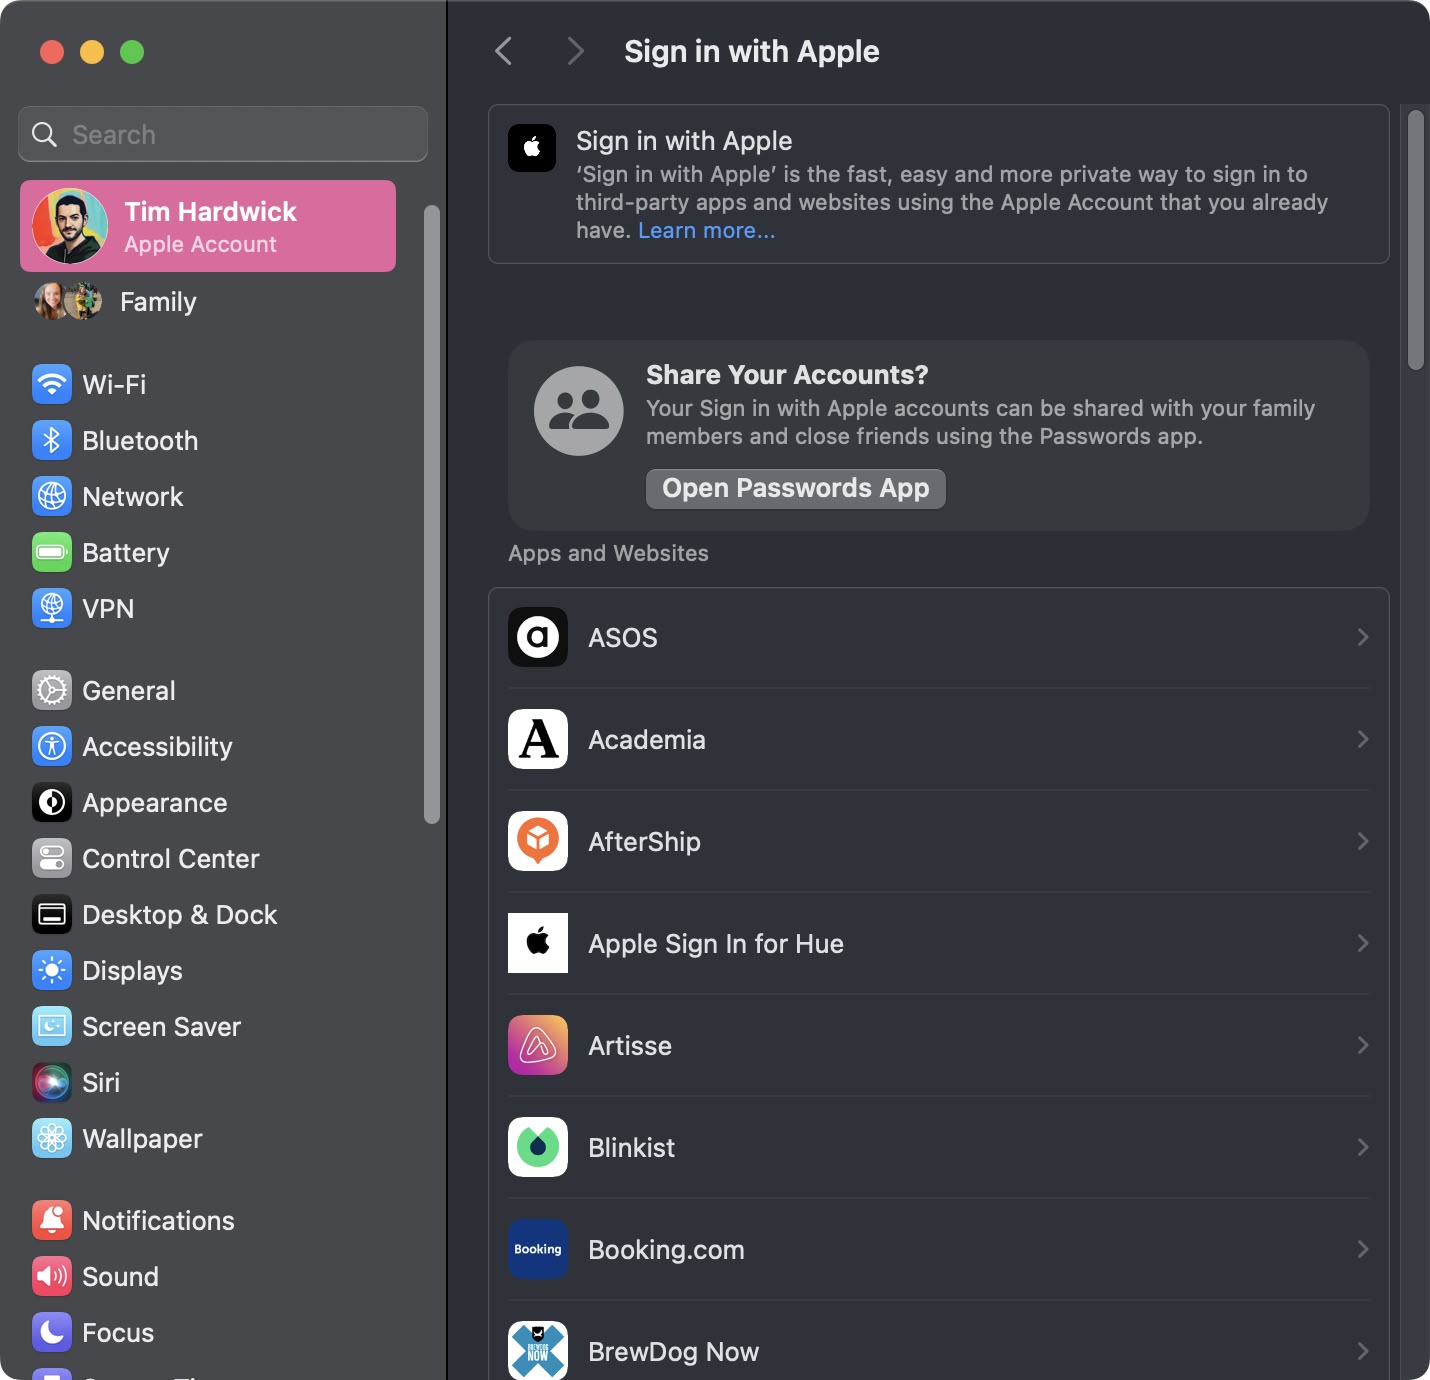
In the Apple Account (formerly Apple ID) section of System Settings, there's a new section called Sign in with Apple that shows you a list of all the websites and services where you use the sign-in with Apple service. From here, you can also opt to share your sign-ins with other members of your family members and close friends via the Passwords app.
38. Home and Work Locations in Weather
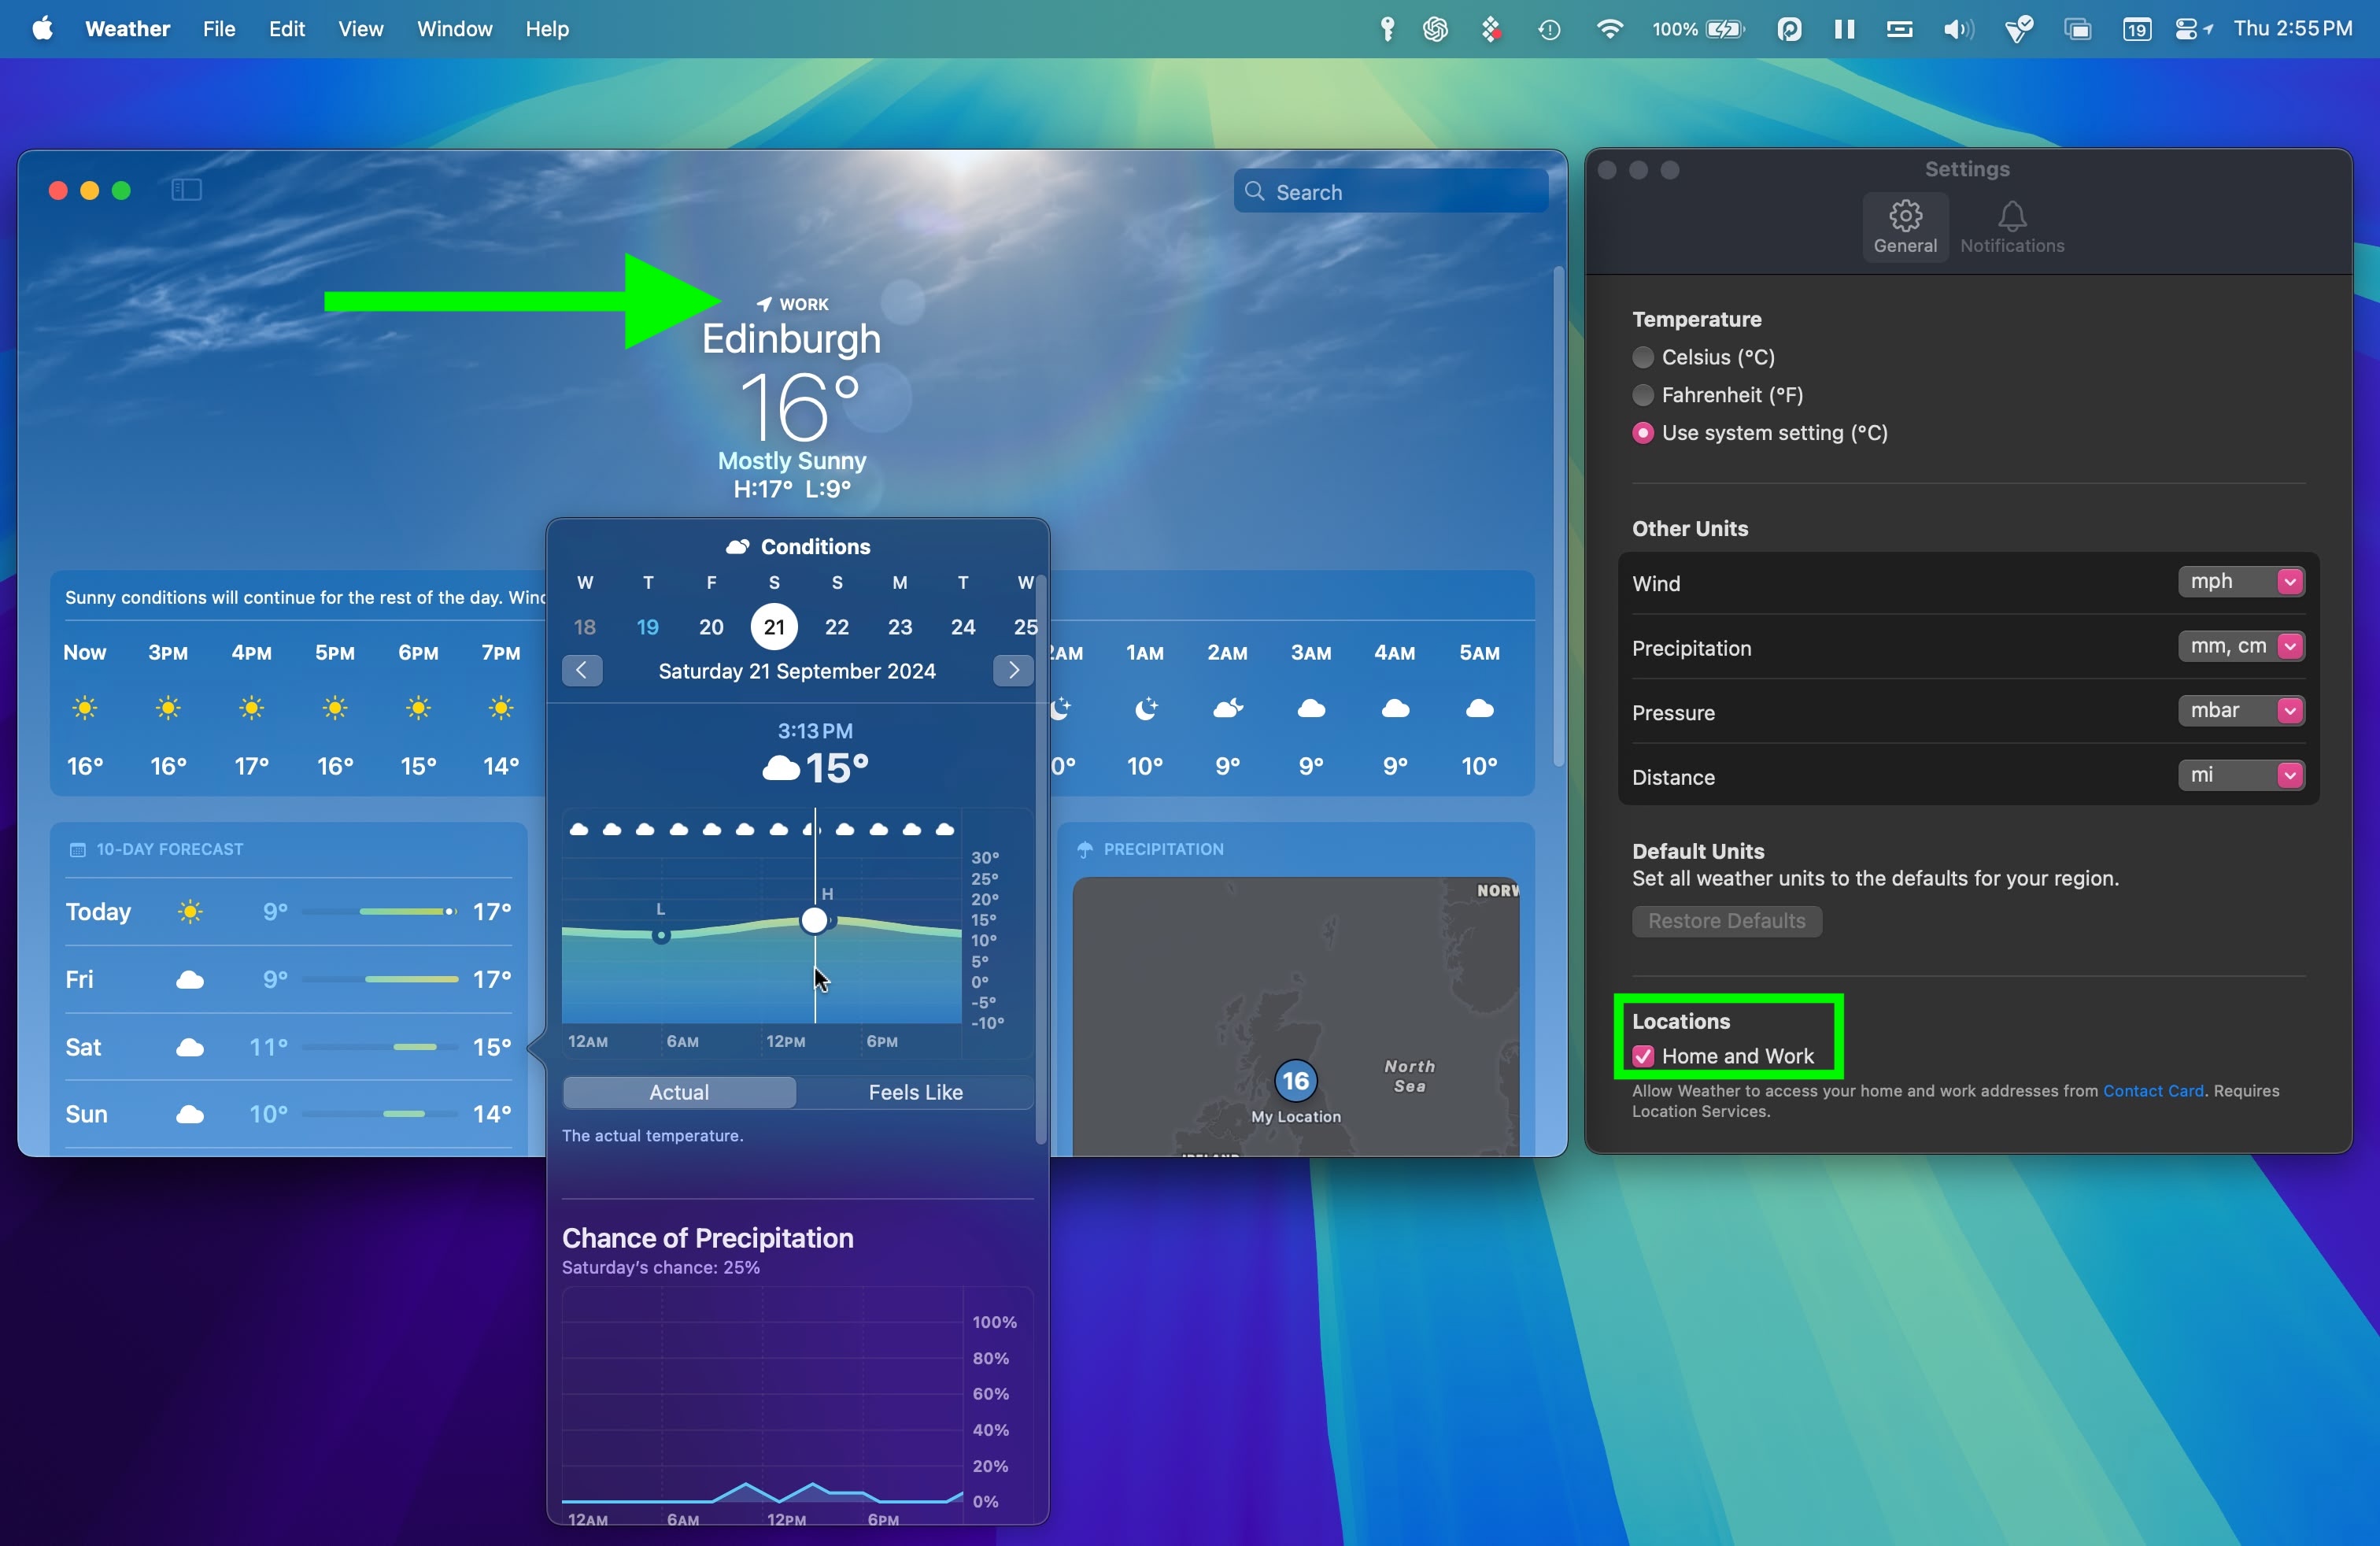
In the Weather app's Settings, there's a new Home and Work option under "Locations," so if you have two different places where you live and where you work, you can have them labeled as such in the app. Home and work locations can be updated by editing your Contacts card.
If you click on the daily forecasts in the main Weather screen, you'll also see a more comprehensive consolidation of weather conditions for that day.
39. Messages Text Effects and Formatting
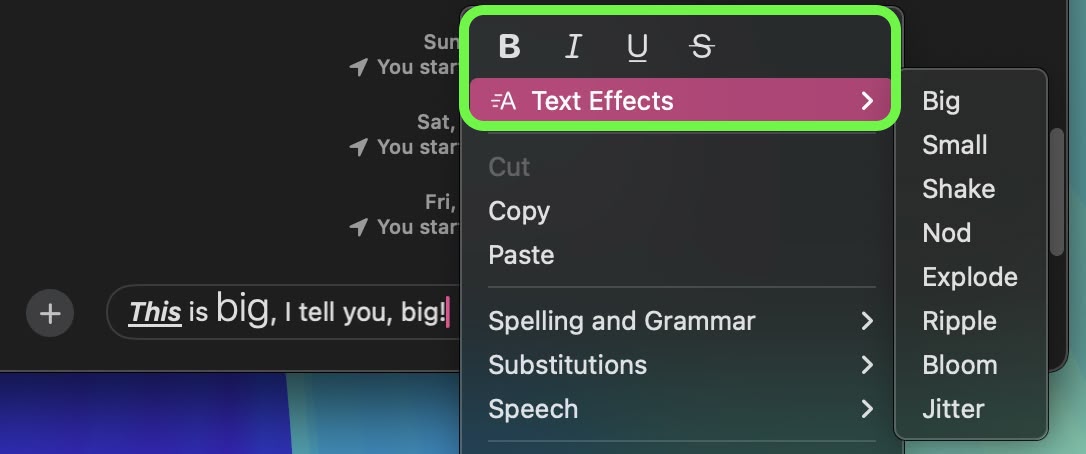
Among the new features in the Messages app, you can now add neat text effects to your messages to make them more expressive. The new animated text effects can be applied to your entire message, a single word, a phrase, or even an emoji or sticker. The options include Big, Small, Shake, Nod, Explode, Ripple, Bloom, and Jitter.
Using the same contextual menu, you can also now add emphasis to your text messages using bold, italic, underline, and strikethrough formatting. You can now apply these formatting options to entire messages, individual words, or even specific letters, offering a higher degree of customization in how you communicate.
40. Make Siri Listen for Atypical Speech
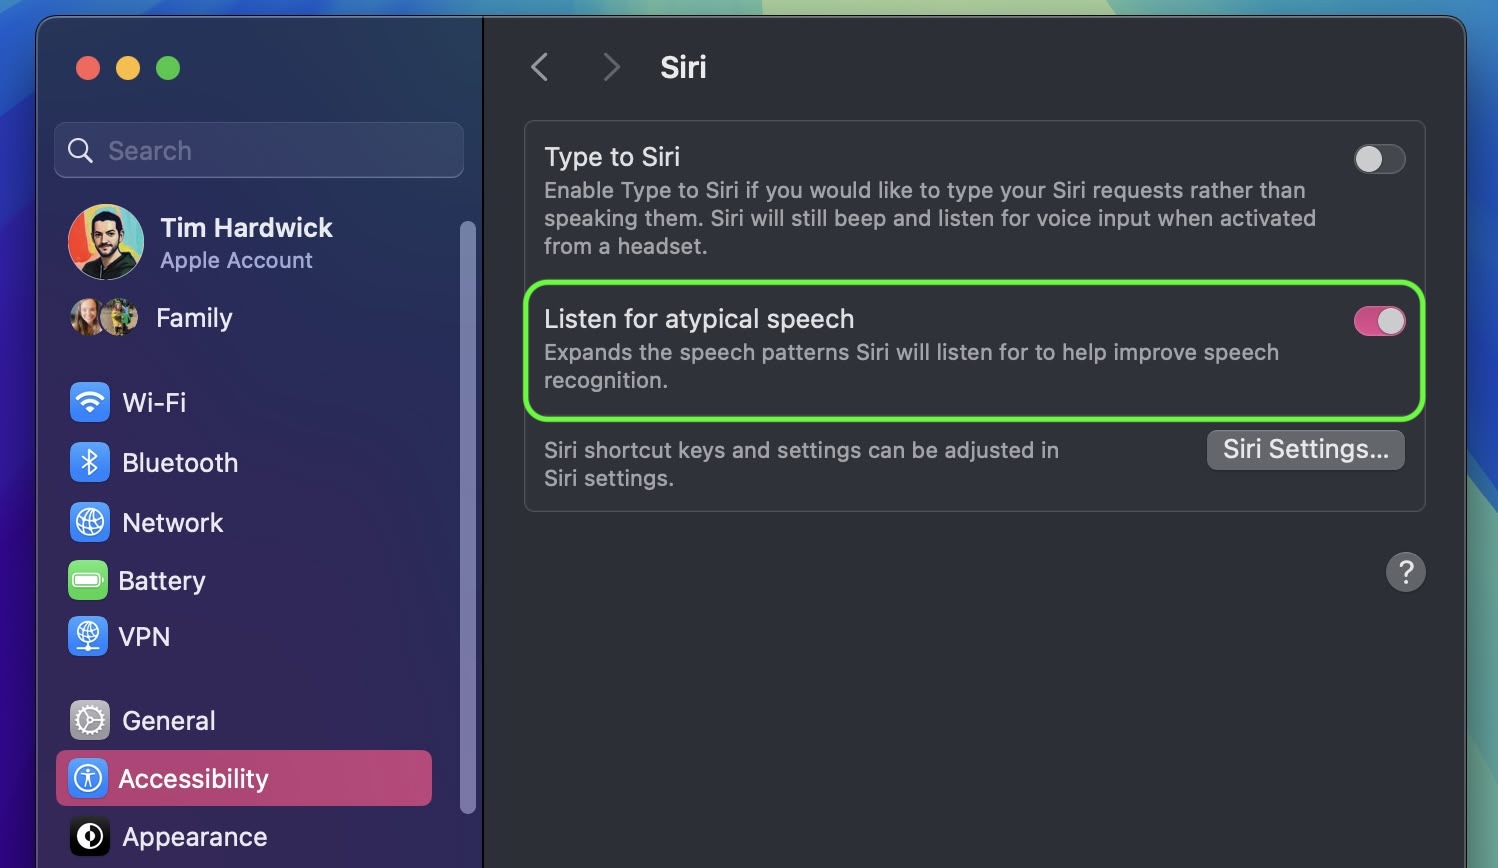
In System Settings ➝ Accessibility, under the "Siri" section, there's a new option to make Siri listen for atypical speech. This feature expands the speech patterns Siri will listen for to help improve speech recognition, according to Apple's description.
41. HDMI Passthrough Support
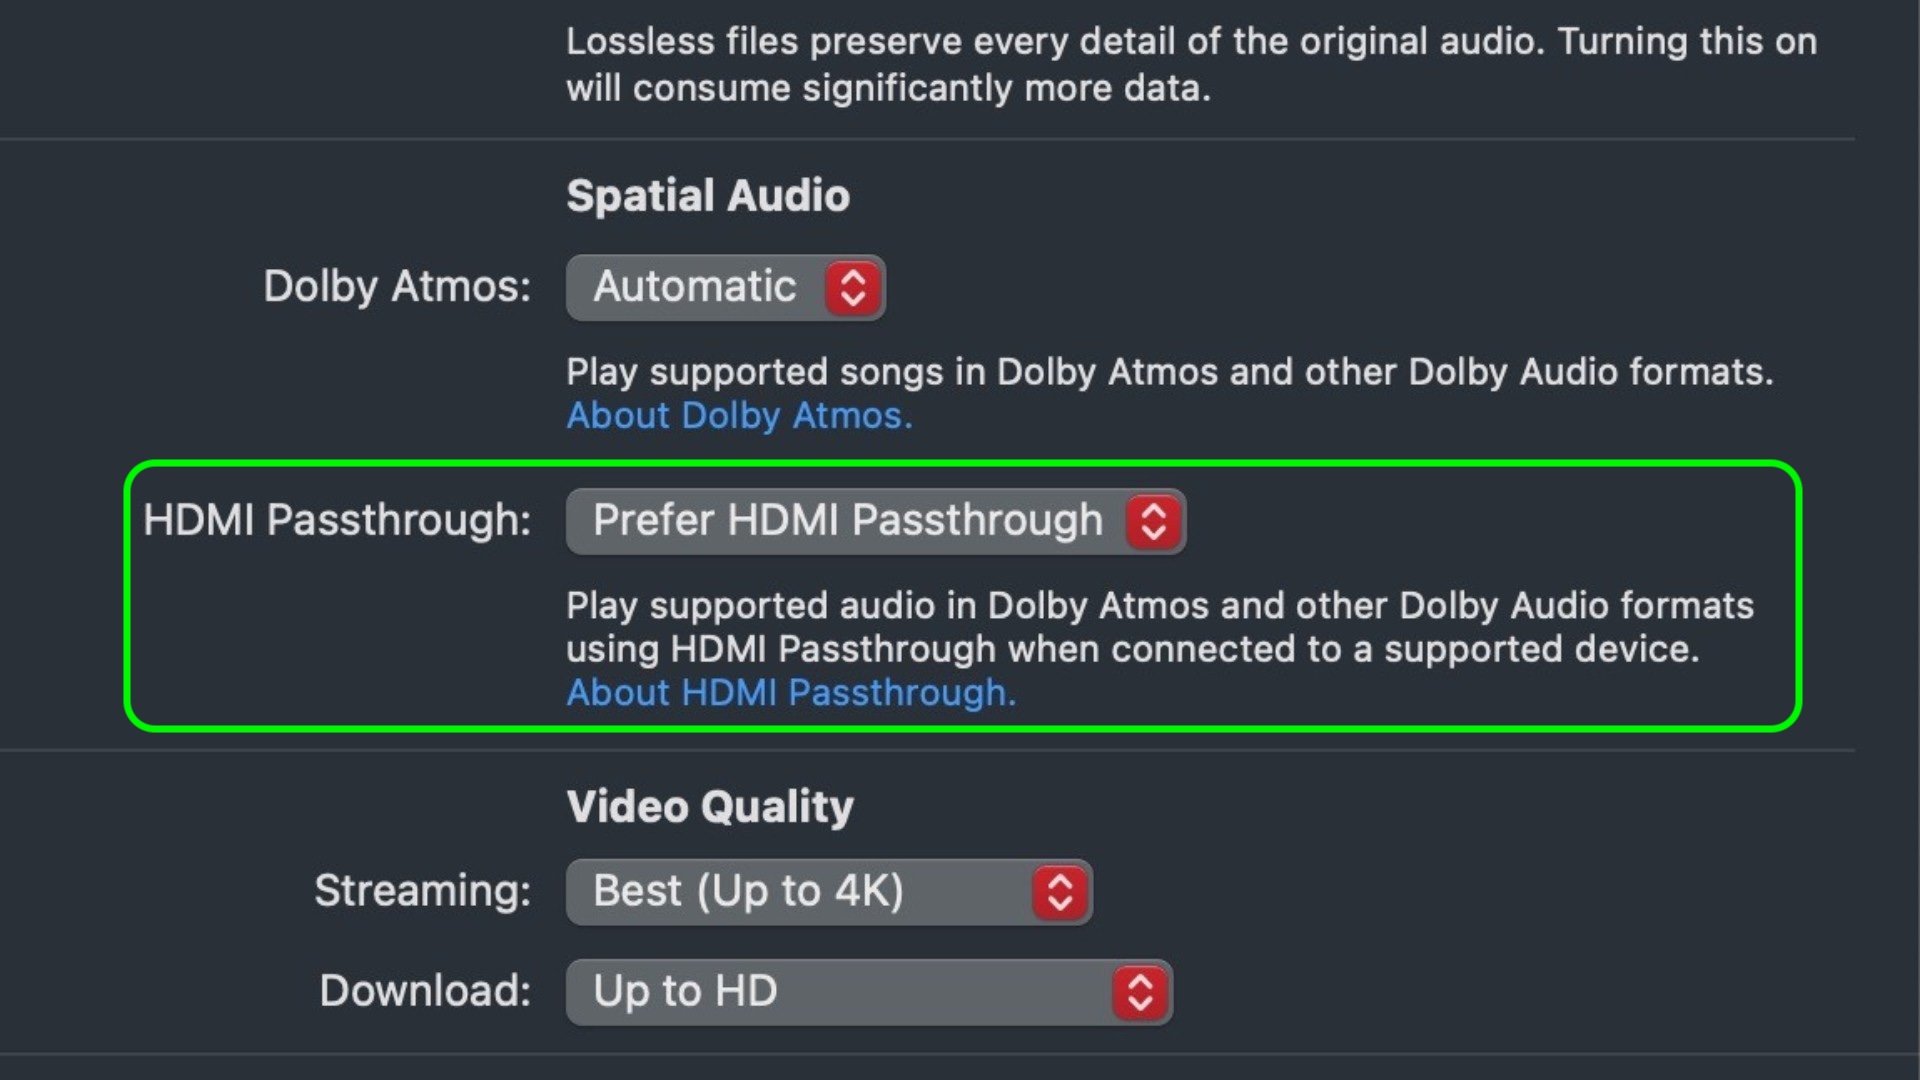
In macOS Sequoia, several Apple apps have gained a new HDMI Passthrough feature that enables a Mac to send an unaltered Dolby Atmos audio signal to a connected AV receiver or soundbar. The new functionality appears in various places in macOS 15, including Apple's TV, Music, and QuickTime Player apps. Apple says turning on the option lets users "Play supported audio in Dolby Atmos and other Dolby Audio formats using HDMI Passthrough when connected to a supported device."
This feature is likely to be welcomed by users who connect their Mac to an external device that supports Dolby Atmos, such as an AV receiver or soundbar. When conected via HDMI cable, the device will be able to decode and output the full immersive Dolby Atmos audio as it was meant to be experienced by the creators, while sending any accompanying video signal to a connected TV.
42. Reminders in Calendar
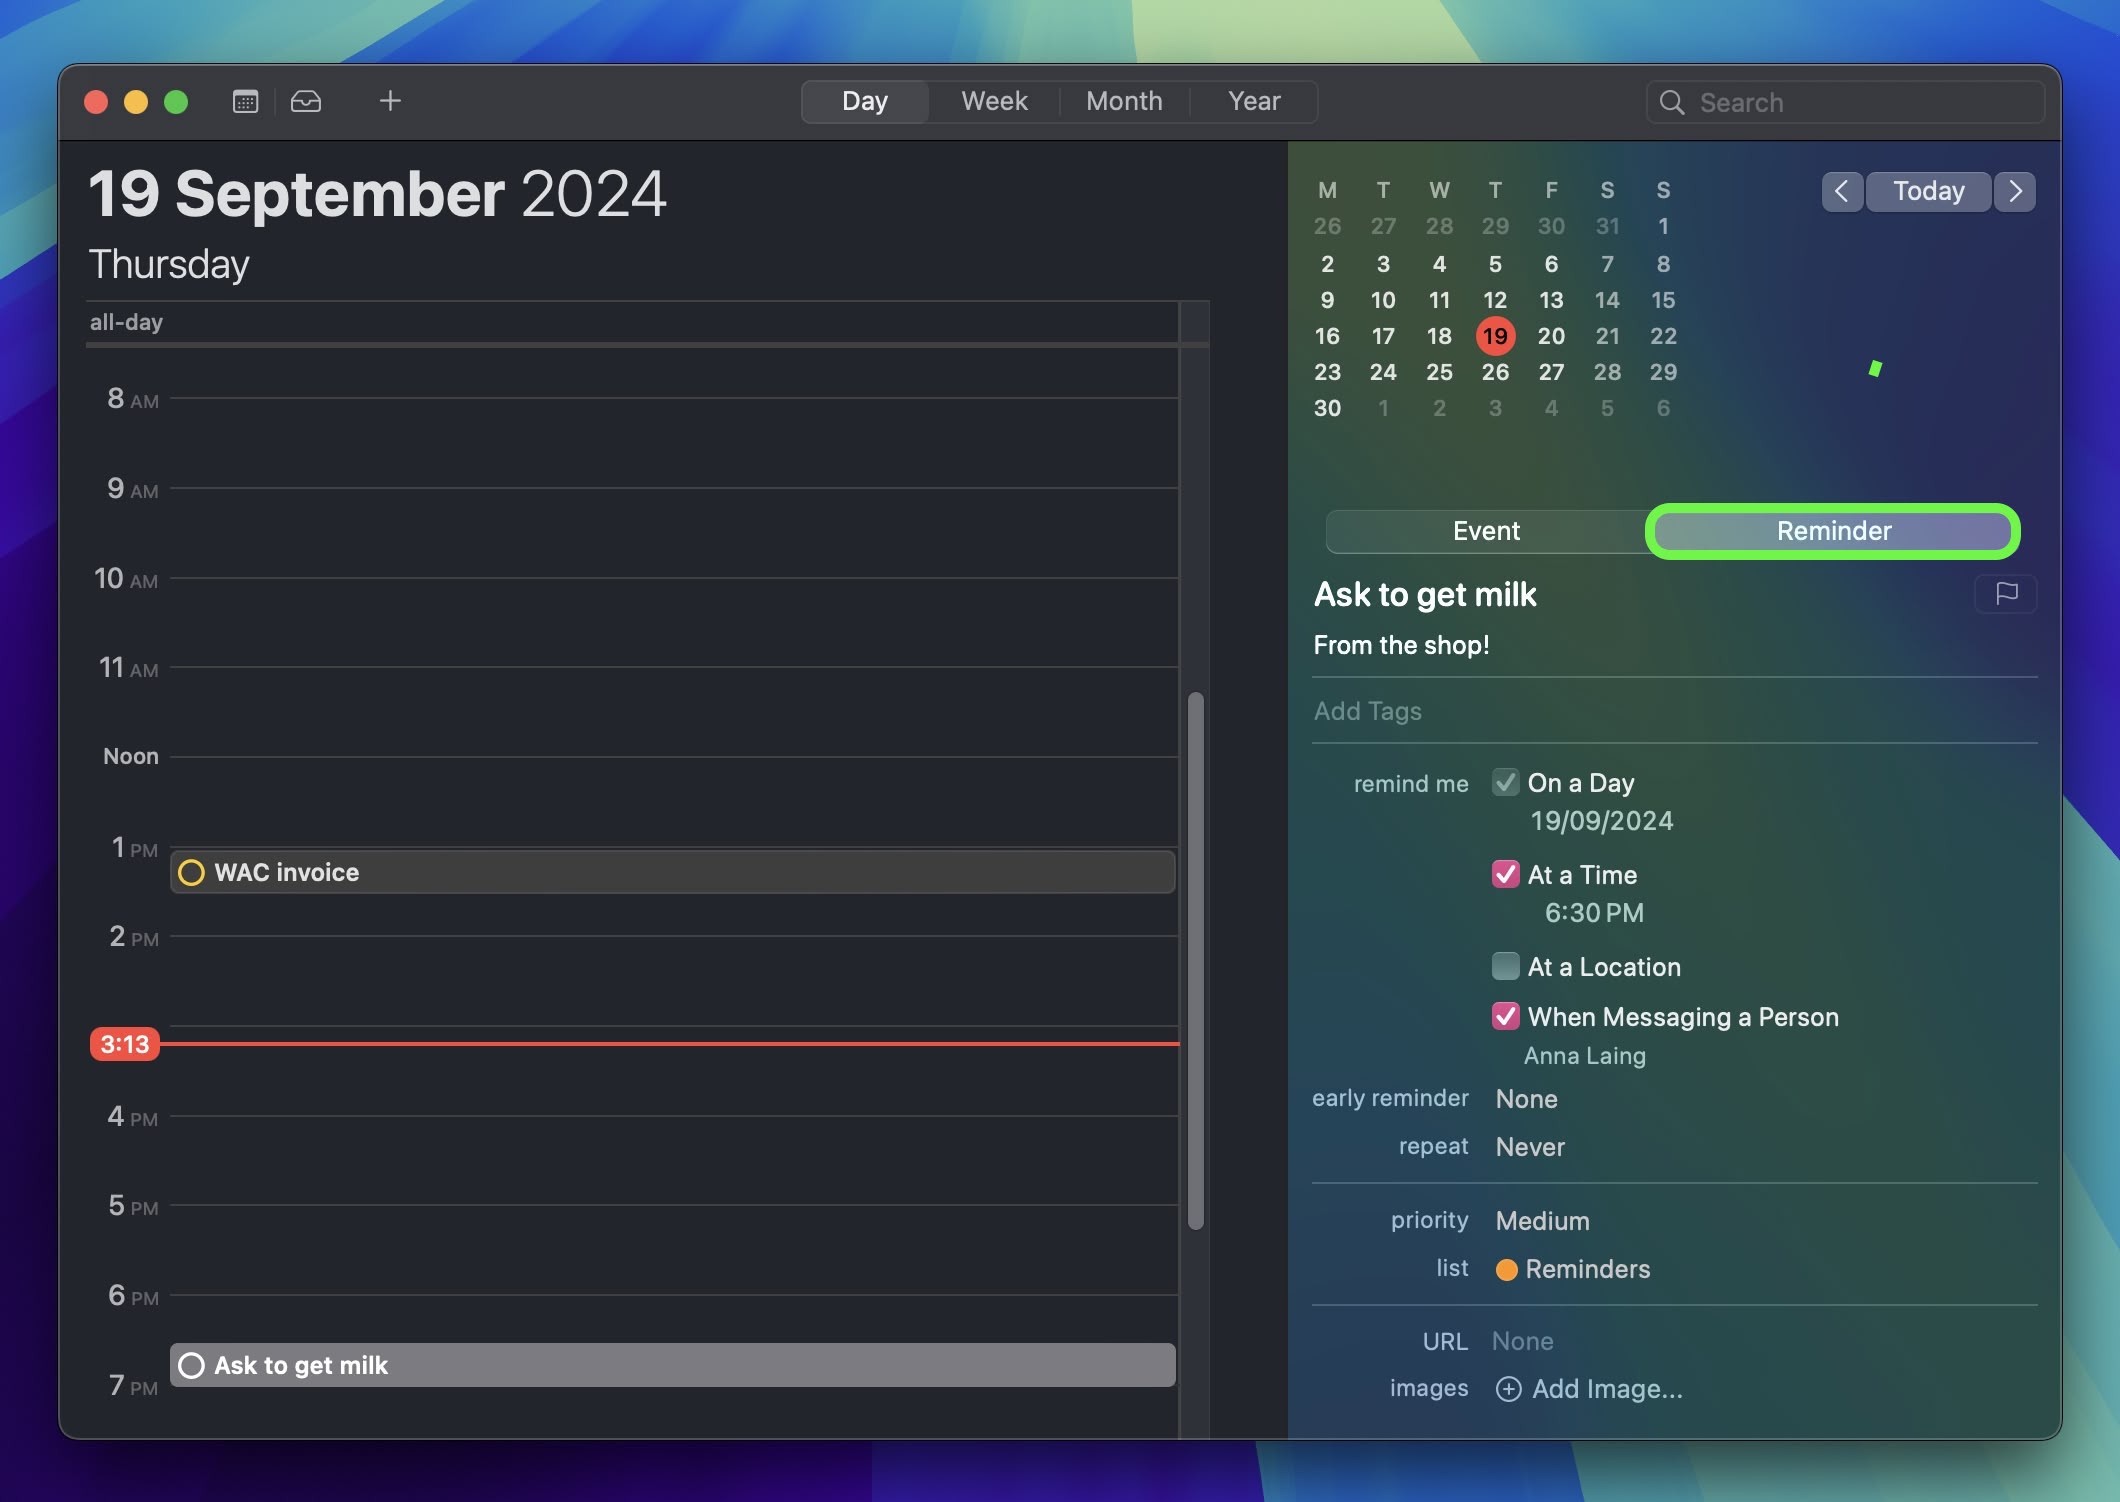
Like iOS 18, macOS Sequoia introduces long-awaited Calendar app integration with Reminders. Adding a reminder to a day or hour is as easy as right-clicking and selecting Add reminder. The Calendar interface includes all the reminder functions you'd want to have access to, without having to open the Reminders app.
43. Headphone Accommodations
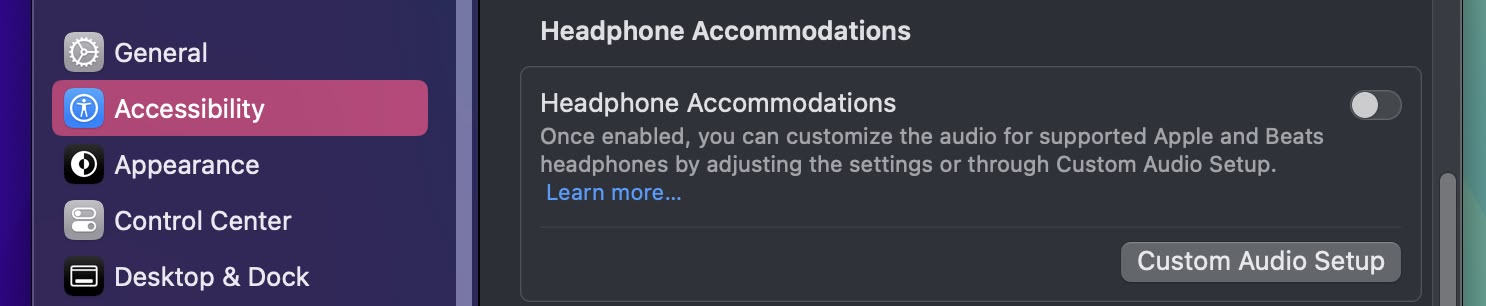
In System Settings ➝ Accessibility ➝ Audio, you'll now find Headphone Accommodations, a feature previously only available on iOS and iPadOS. This tool allows you to customize audio output for select Apple and Beats headphones to suit your hearing needs.
To use this feature, you engage in a "Custom Audio Setup" process. This involves resetting your EQ and Balance settings to their defaults, then listening to various audio samples, and selecting the sample that sounds best to you. Choosing "Use Custom Settings" will apply these preferences.
44. System Settings Default Behavior
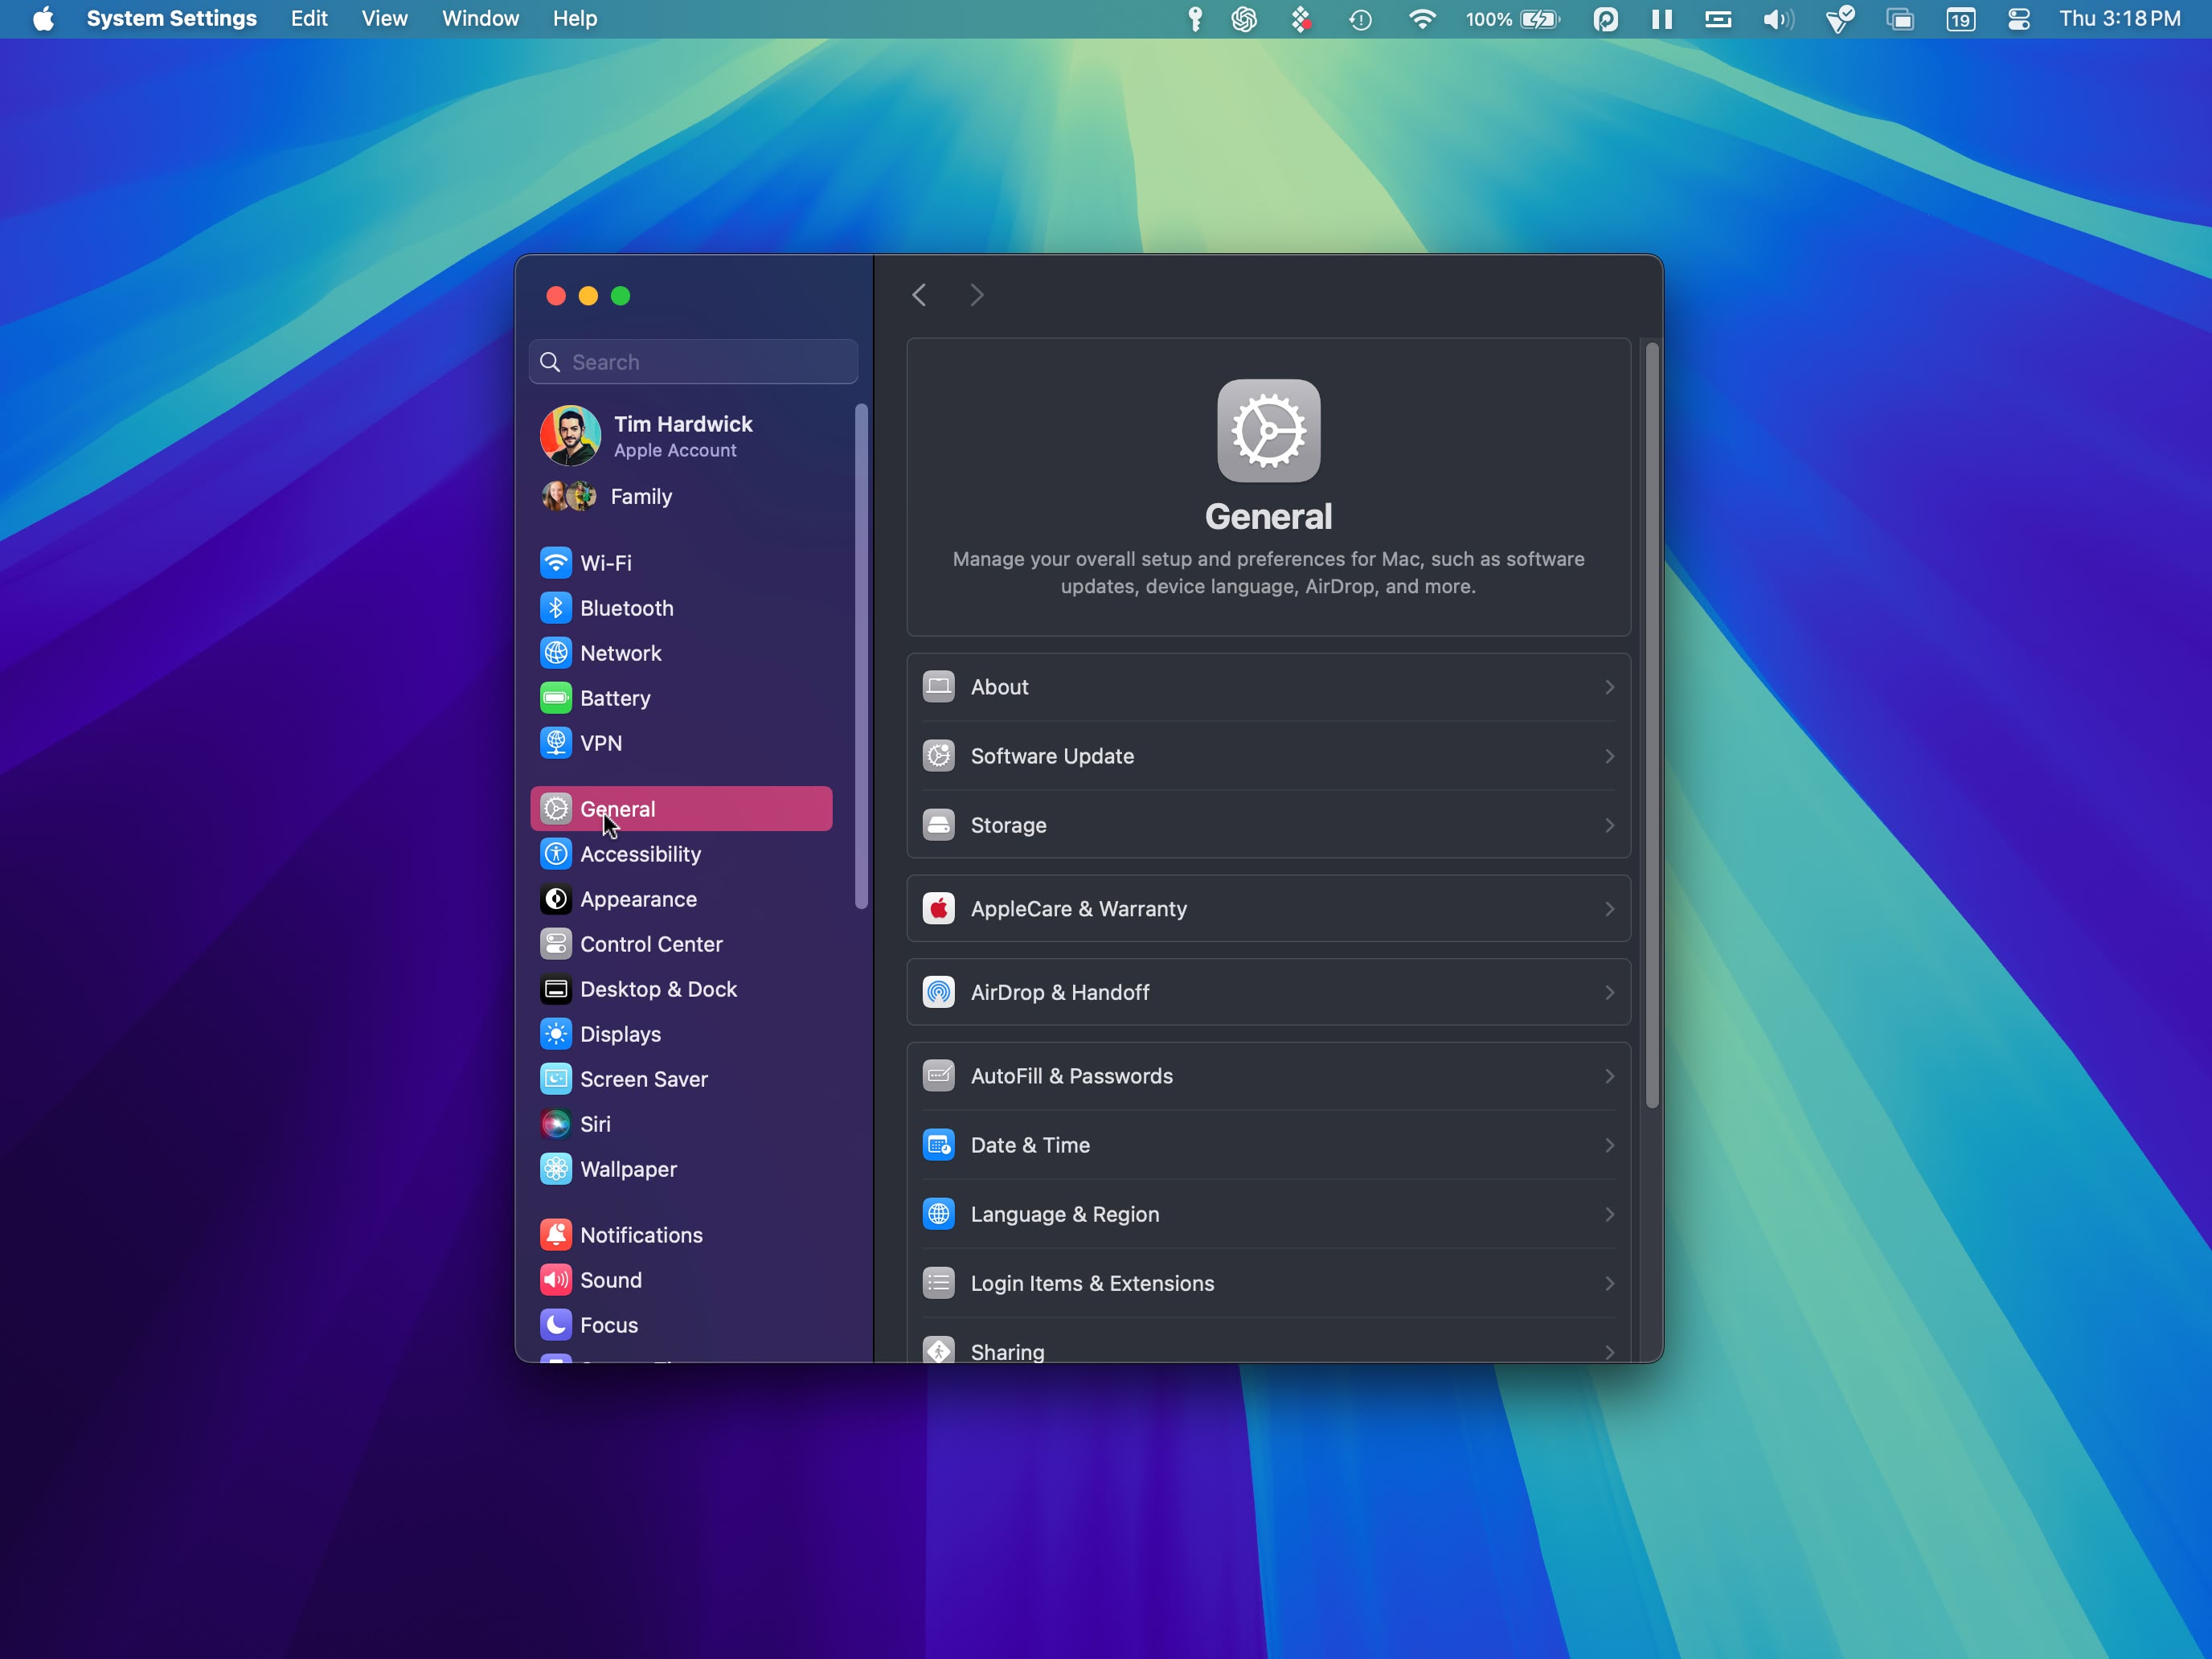
Apple has made changes to the System Settings interface to improve accessibility and navigation. A key modification is the new default view: Upon opening System Settings, you'll now see the General tab first, rather than the Appearance menu as in previous versions. This change places frequently used options in a more prominent position and reduces the number of steps required to access common settings.
45. Inline Math in Many Fields
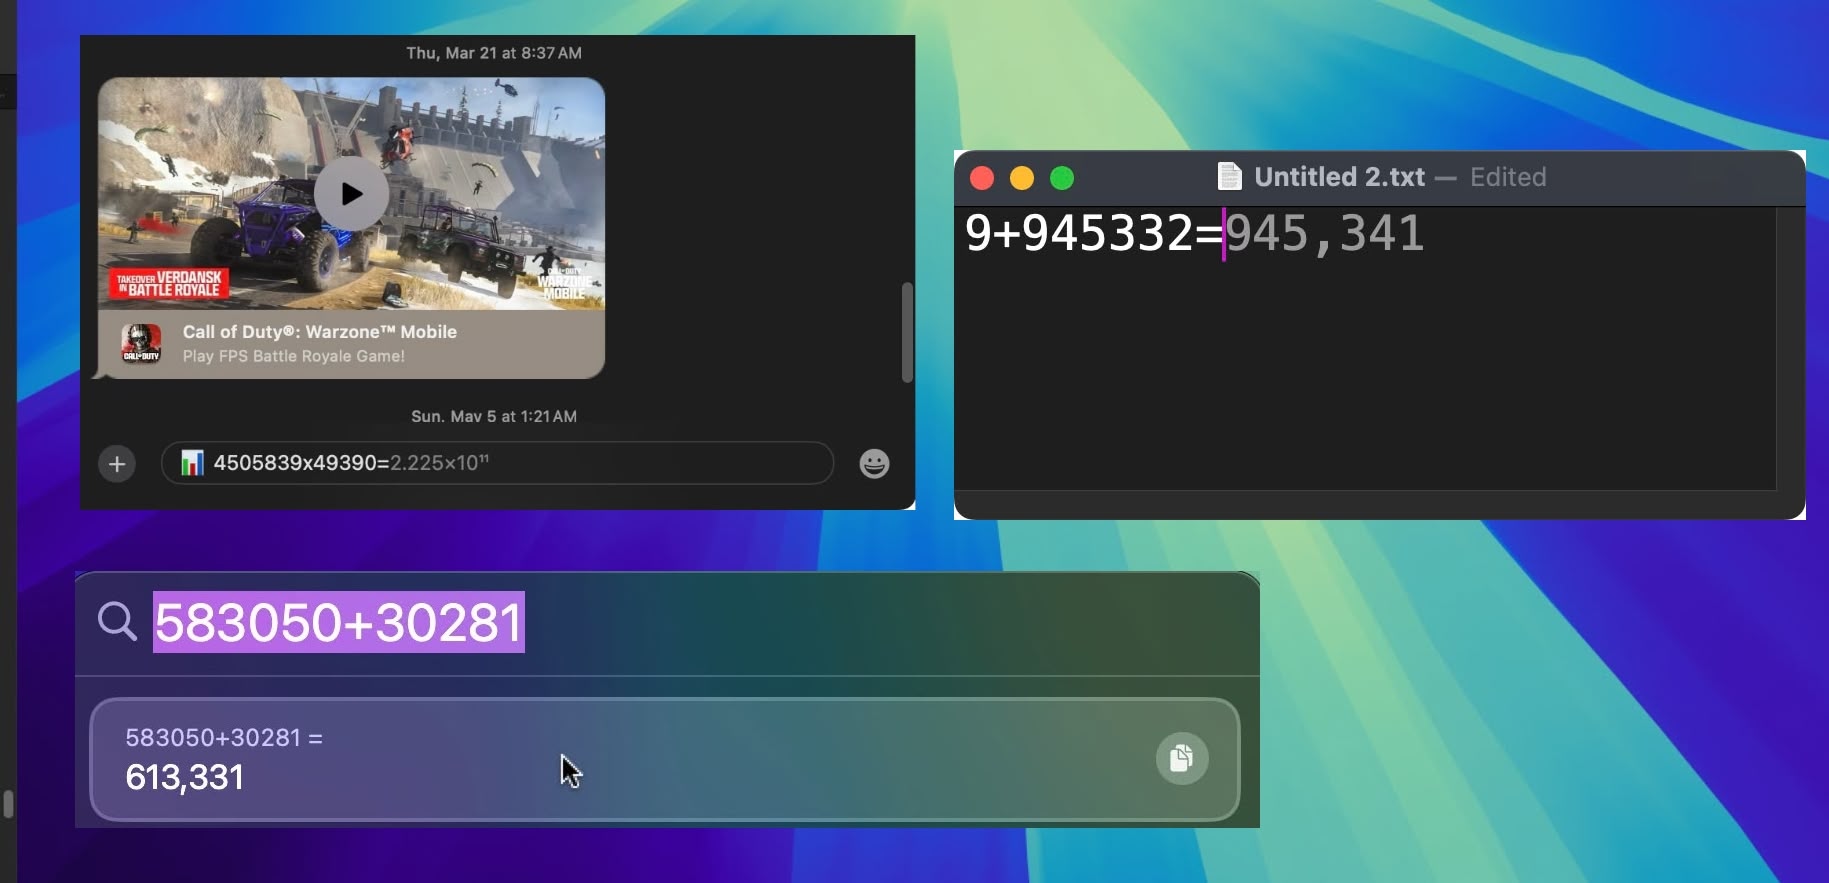
You're not limited to accessing the new Math features through the Calculator – you can also use the feature directly within the Notes app using any new or existing note. In fact, you can get Math results almost anywhere in the operating system where you type. If you type a calculation into Spotlight, you'll still get a result, but the same now goes for apps like TextEdit and Messages.
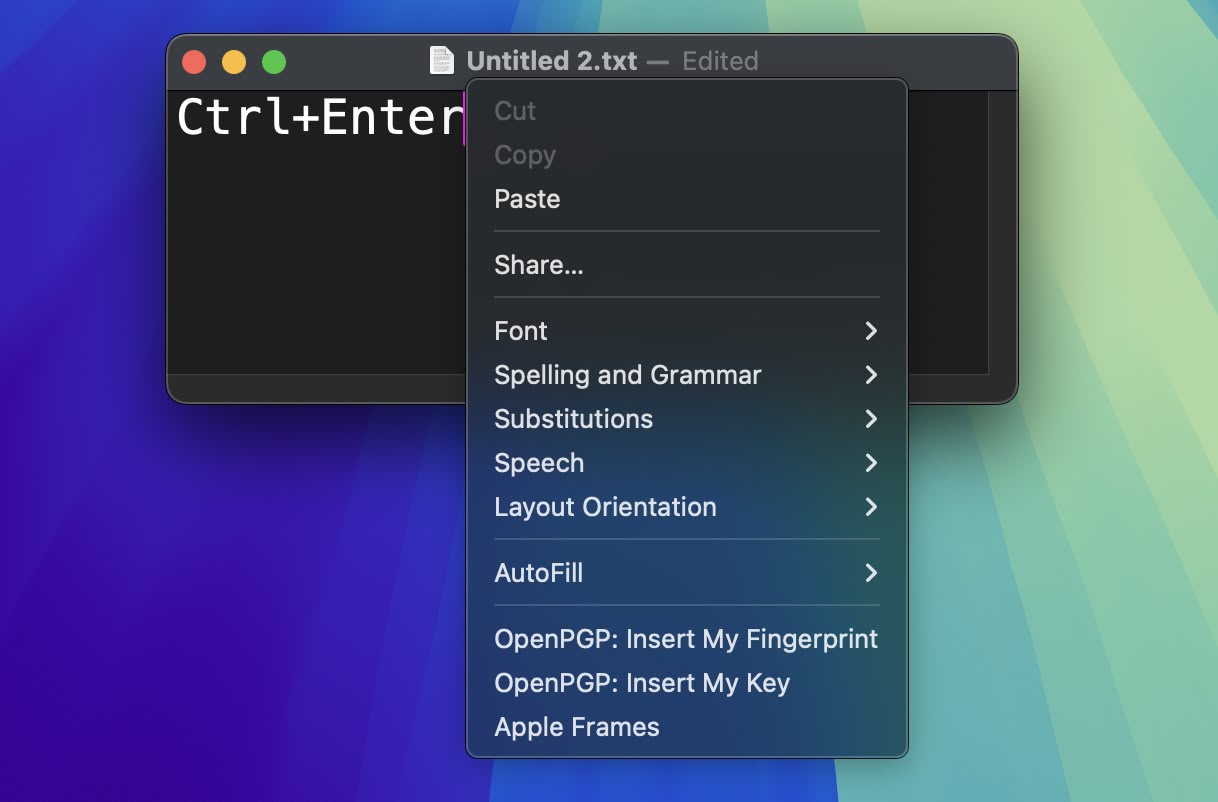
Windows has had this feature for ages, and finally it's come to Mac. In Sequoia, you can now open a contextual menu in text-based apps by pressing Control+Enter, so if you make a text selection or just want to choose a contextual option while you're typing away, your fingers no longer need to leave the keyboard.
47. iPhone Mirroring Touch ID Support
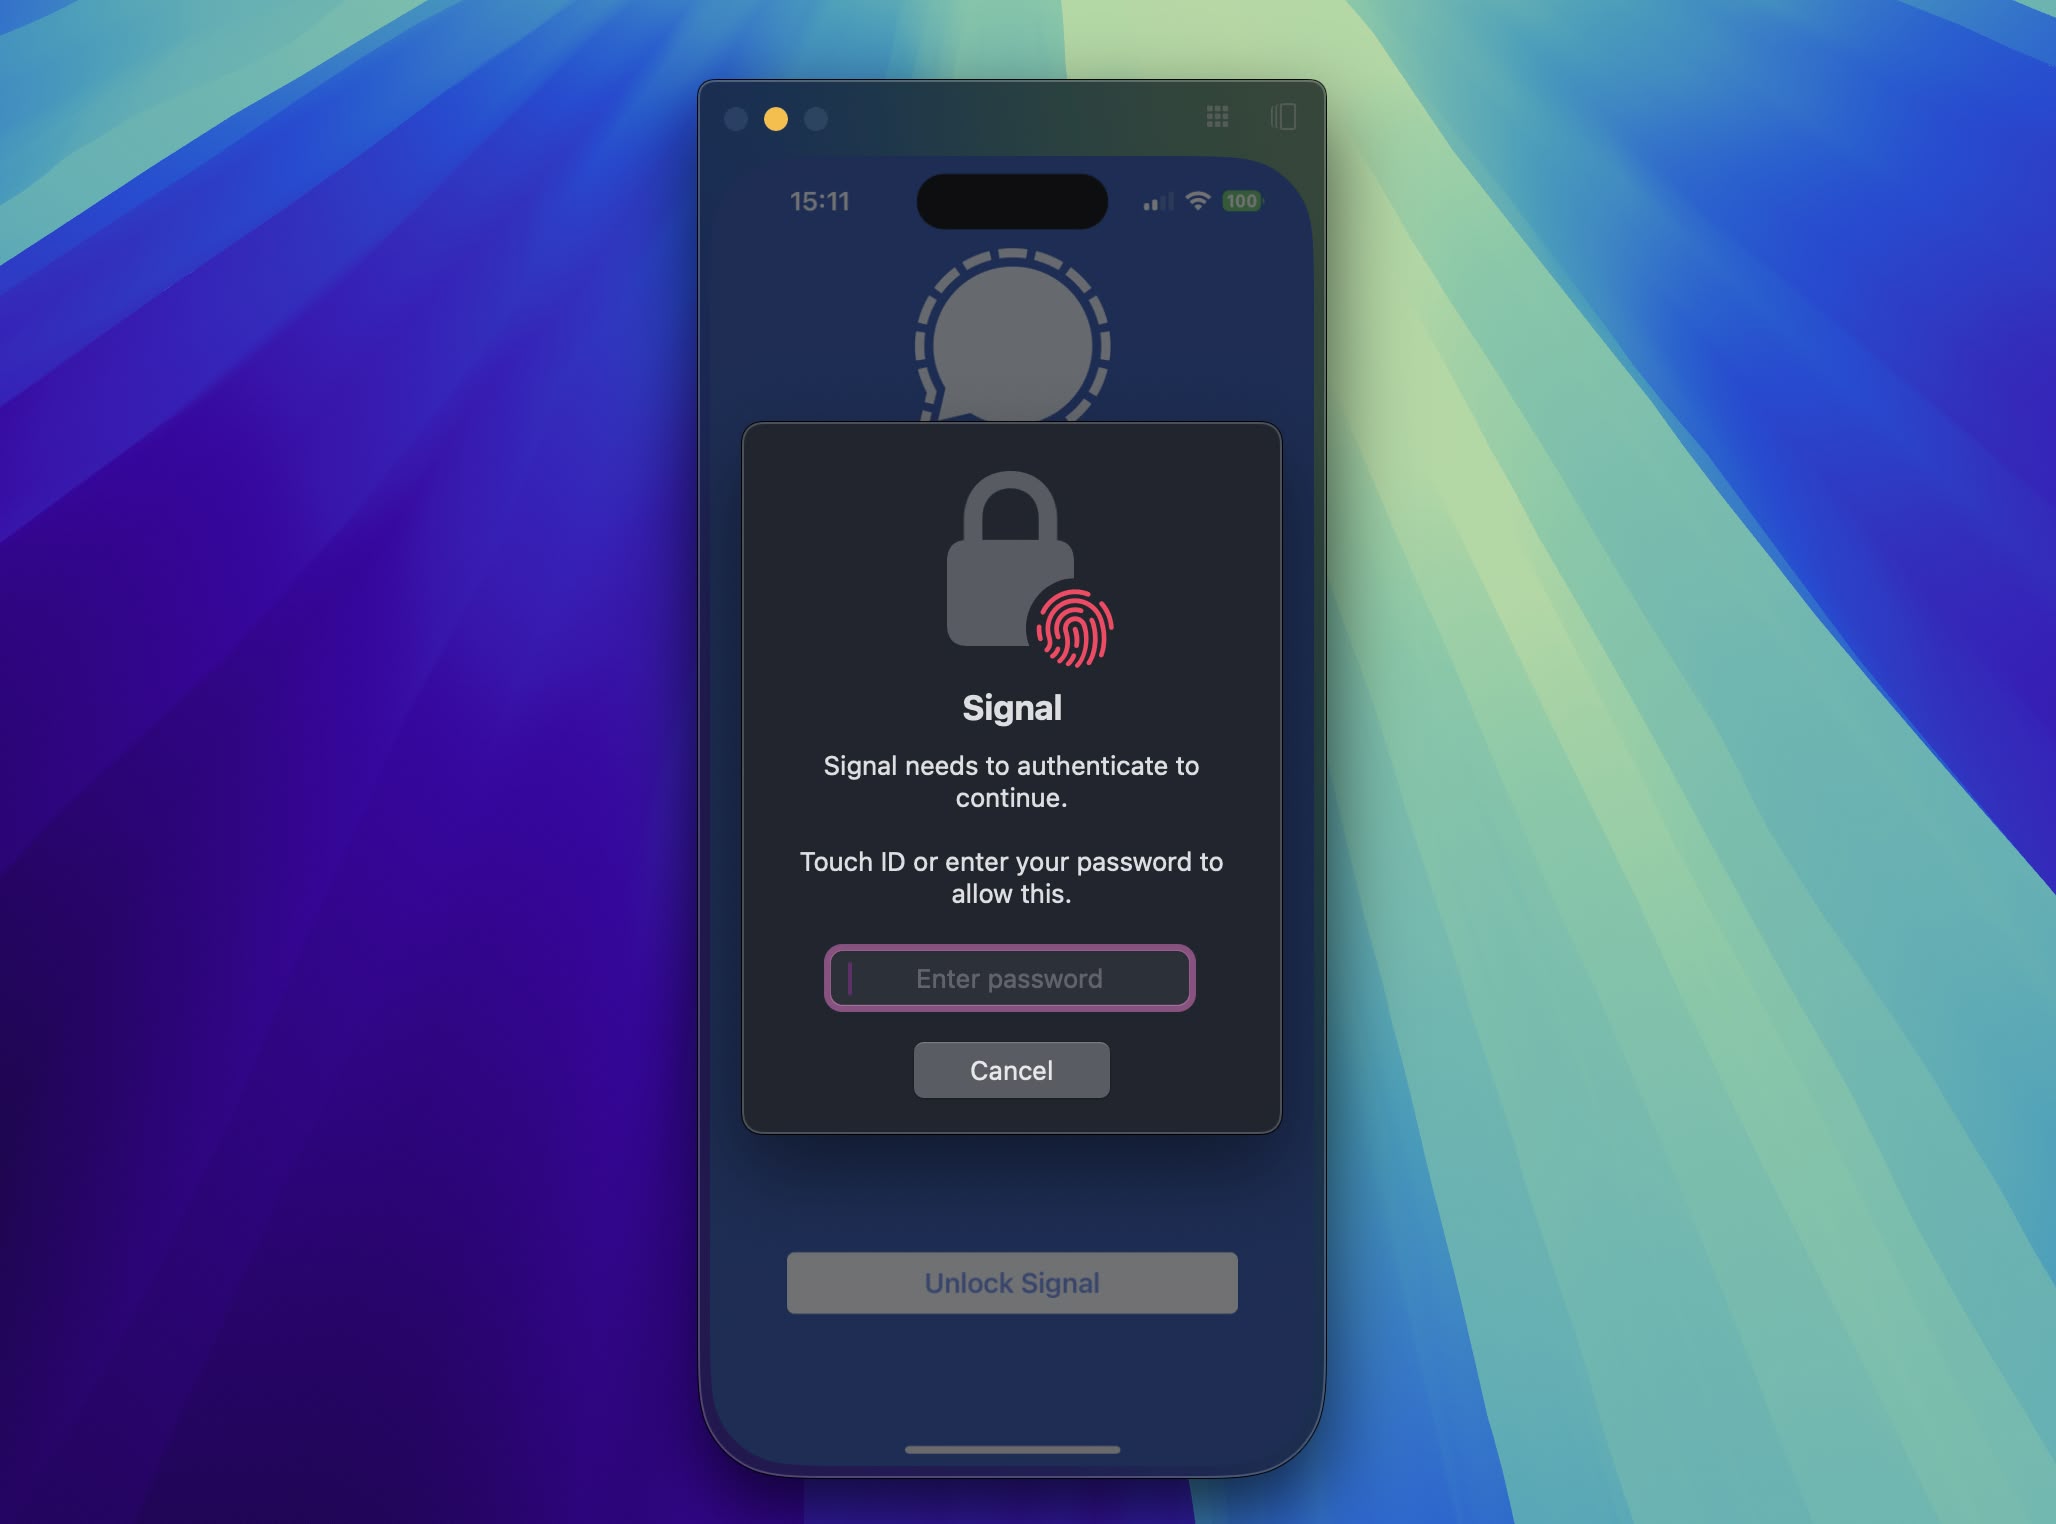
If you're mirroring your iPhone to your desktop and attempt to open an app that requires authentication, you don't need to pick up your iPhone or resign yourself to an inaccessible app – you can just use Touch ID on your Mac.
48. Redesigned Safari Reader View Options
A longstanding feature in Safari, Reader Mode allows users to view web pages in a simplified format, stripping away ads, videos, and other distractions to focus solely on the text and images. This clean interface has been a favorite among users who prefer a more streamlined reading experience, especially for longer articles or text-heavy websites.
In macOS Sequoia, Apple has redesigned the Reader interface so that it's easier to define your readability and customization options, allowing you to quickly tailor your reading experience to your preferences.
49. Schedule Messages to Send Later
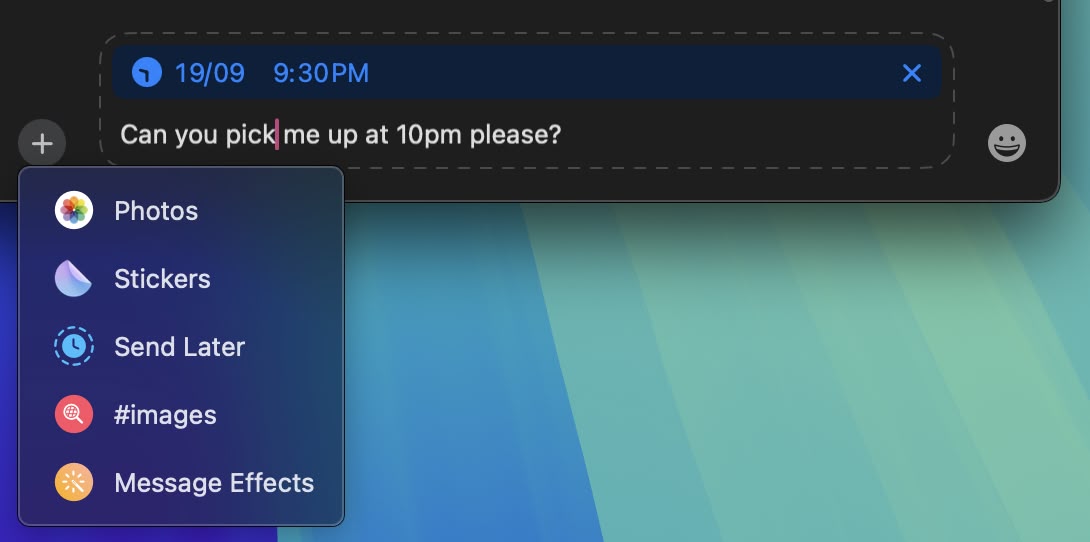
This addition to the Messages app now allows users to schedule text messages for future delivery. Available exclusively for iMessage conversations via the + button, the Send Later function enables you to compose messages in advance and set a specific time or date for them to be sent by editing the clock. This feature is particularly useful for remembering important dates or managing communication across different time zones.
The feature works for both individual and group chats, provided all participants are using Apple devices with iMessage enabled. Scheduled messages are displayed at the bottom of a conversation. If you want to cancel a scheduled message or edit, simply right-click it and select the desired option. Note that messages can be scheduled up to 14 days in advance.
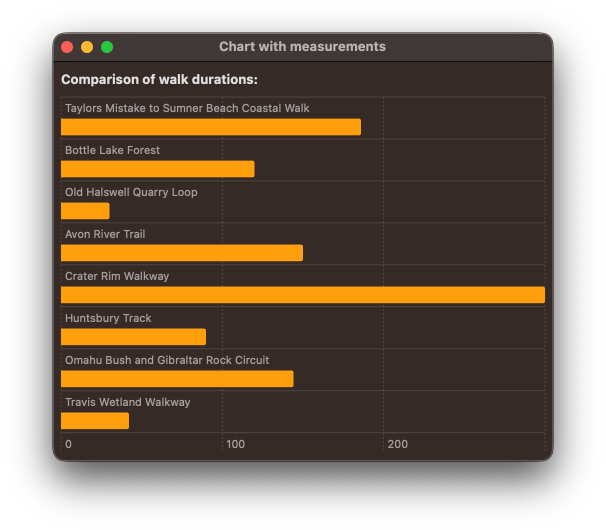
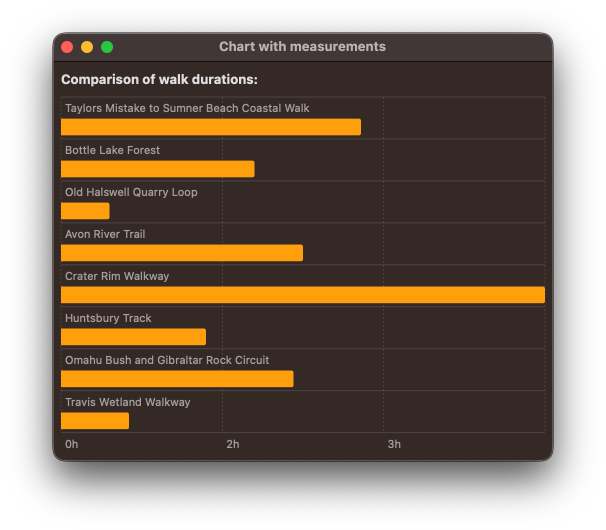
50. Hiking Trails in Maps

The Maps app now features detailed trail networks and hikes, including all 63 U.S. national parks. You can do a search for "hikes" or "hiking routes" in the Maps app to see nearby trail options, with Apple including hike length, elevation, ratings, and other details where available. Hikes can be filtered by length, route type (loop, point to point, or out and back), and elevation, and can be saved for offline access. If you click on a trail, You can also see a full overview of the trail's path and get lengths for each section.

Maps also supports custom routes, so you can plan out a specific hiking route that you want to take. At a trailhead, you can click on the "Create a Custom Route" option to initiate the custom routing experience. From there, click on the map to begin setting points for your route, and the Maps app will provide length and elevation details. You can also have the Maps app finish a route automatically by selecting the Reverse, Out and Back, or Close Loop options (shown in the image in the top-right corner).
This article, "
50 New macOS Sequoia Features and Changes Worth Checking Out" first appeared on
MacRumors.comDiscuss this article in our forums